Sentiment analysis and brand management SaaS tools enable users to find brand mentions and categorize emotions in texts in a matter of a few clicks. These solutions make it easier for users to stay tuned to the online conversation happening around their brand.
At DataForSEO, we’re helping our customers to collect brand or keyword mentions from across the web, and automatically score sentiment polarity and more advanced emotions using our multilingual (70+ lang.) Content Analysis API.
In this guide, we will carefully illustrate how it can streamline the creation of essential brand management functionality.
Project Setup
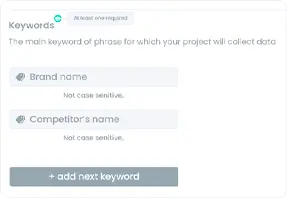
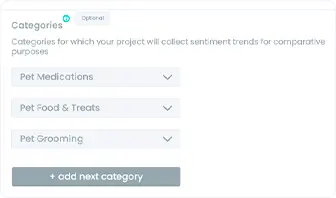
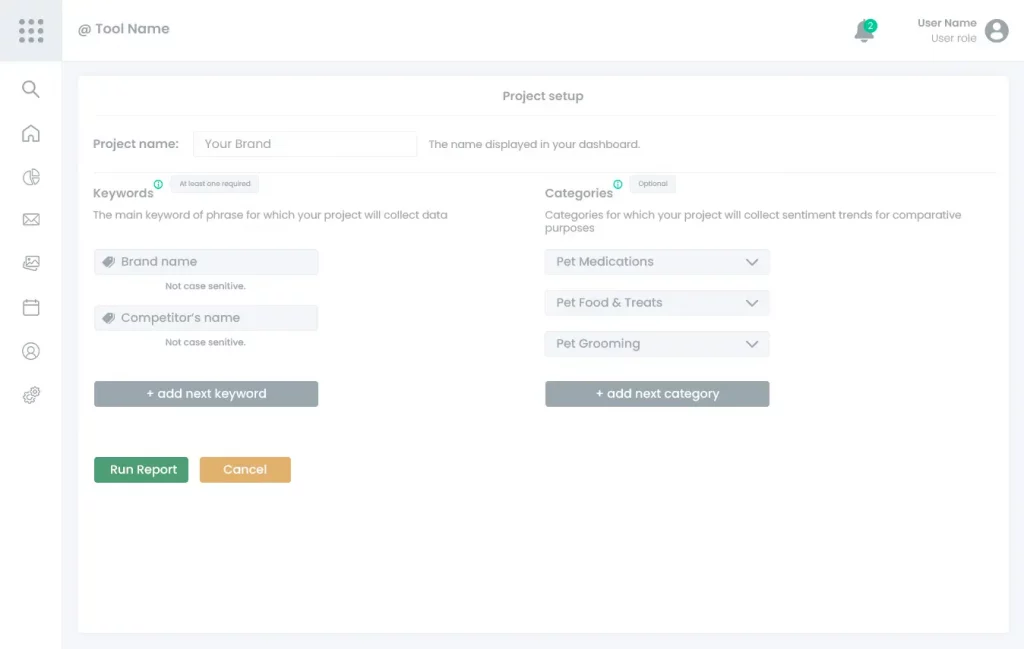
The project setup is the first screen a user sees. It contains all elements necessary for creating a new project and defining target keywords and categories to monitor. While the project name is merely a convenience for users, keyword and category inputs are necessary for the development side. Configuring these two inputs correctly ensures you get the right data in the tool’s further functionality.
Components
A keyword input should be copied to the target keyword field in the body of your POST requests. Note that for each keyword a user enters in the Project Setup, you’ll need to make a separate call to each of the following Content Analysis API endpoints:
        # Instead of 'login' and 'password' use your credentials from https://app.dataforseo.com/api-dashboard
        login="login"
        password="password"
        cred="$(printf ${login}:${password} | base64)"
        curl --location --request POST "https://api.dataforseo.com/v3/content_analysis/summary/live"
        --header "Authorization: Basic ${cred}"
        --header "Content-Type: application/json"
        --data-raw "[
          {
              "keyword": "logitech"
          }
        ]"
Category Input
Category Input is an optional element of the Project Setup. If a user wants to review sentiment trends of all mentions in a specific category(-ies), they can indicate the desired categories here.
You’ll need to use these input values in the body of your POST request(s) to the Category Trends endpoint to get data for the graphs in Sentiment Over Time by Category.
        {
          "category_code": 10937,
          "category_name": "Bags & Packs",
          "category_code_parent": 10178
        }
        # Instead of 'login' and 'password' use your credentials from https://app.dataforseo.com/api-dashboard
        login="login"
        password="password"
        cred="$(printf ${login}:${password} | base64)"
        curl --location --request POST "https://api.dataforseo.com/v3/content_analysis/category_trends/live"
        --header "Authorization: Basic ${cred}"
        --header "Content-Type: application/json"
        --data-raw "[
          {
            "category_code": 10994,
            "search_mode": "as_is",
            "date_from": "2022-09-01",
            "date_group": "month"
          }
        ]
Mentions Overview
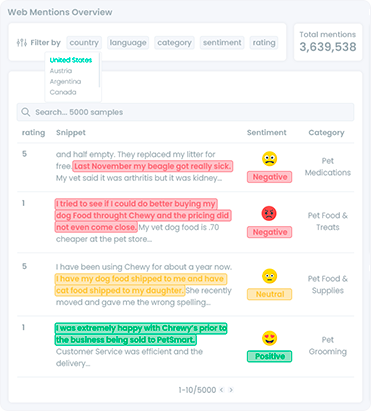
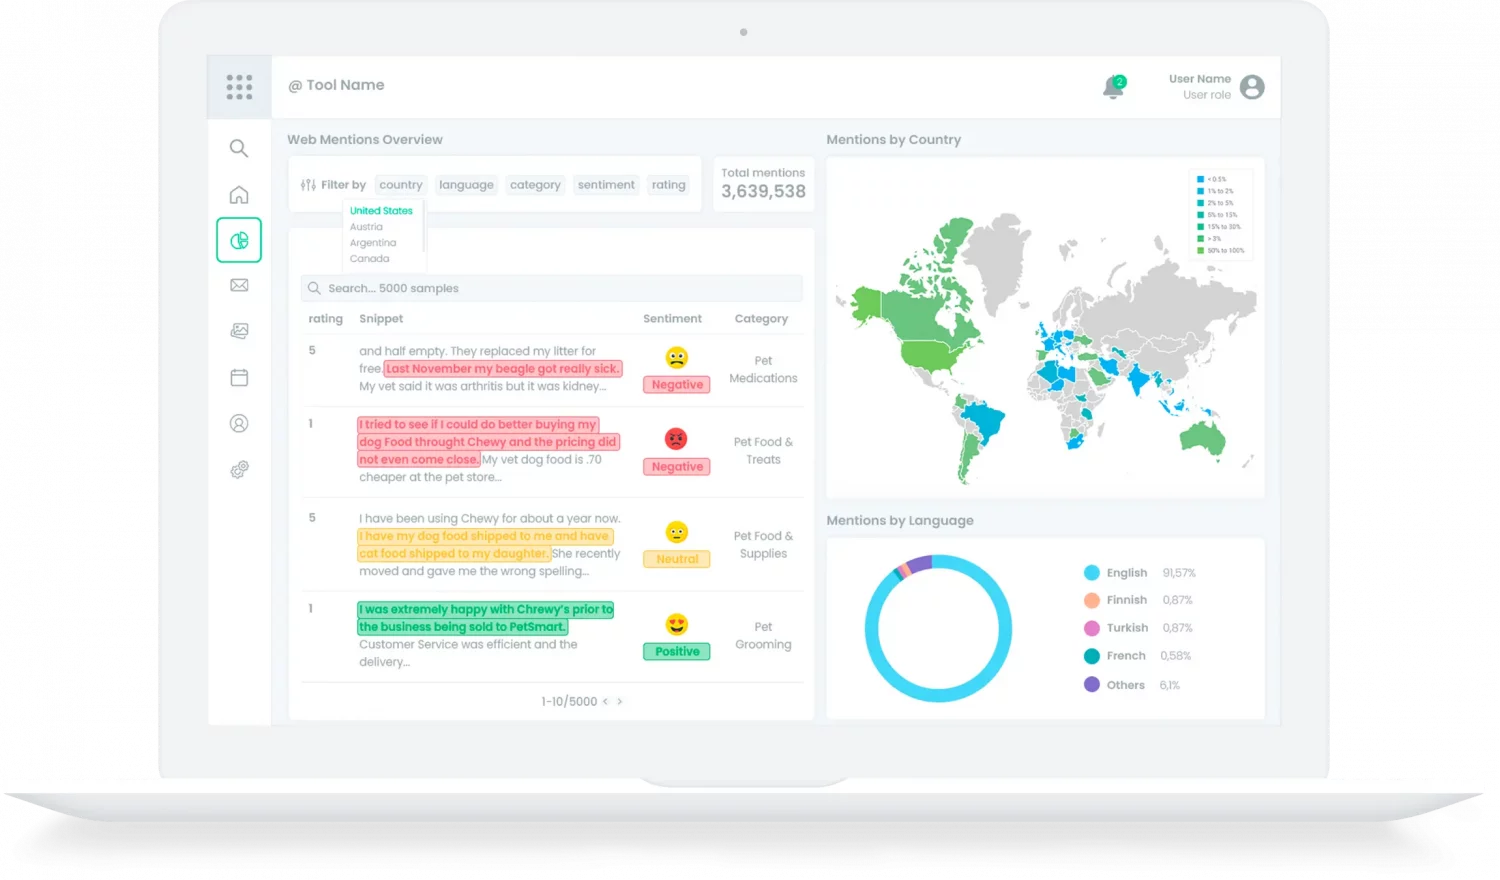
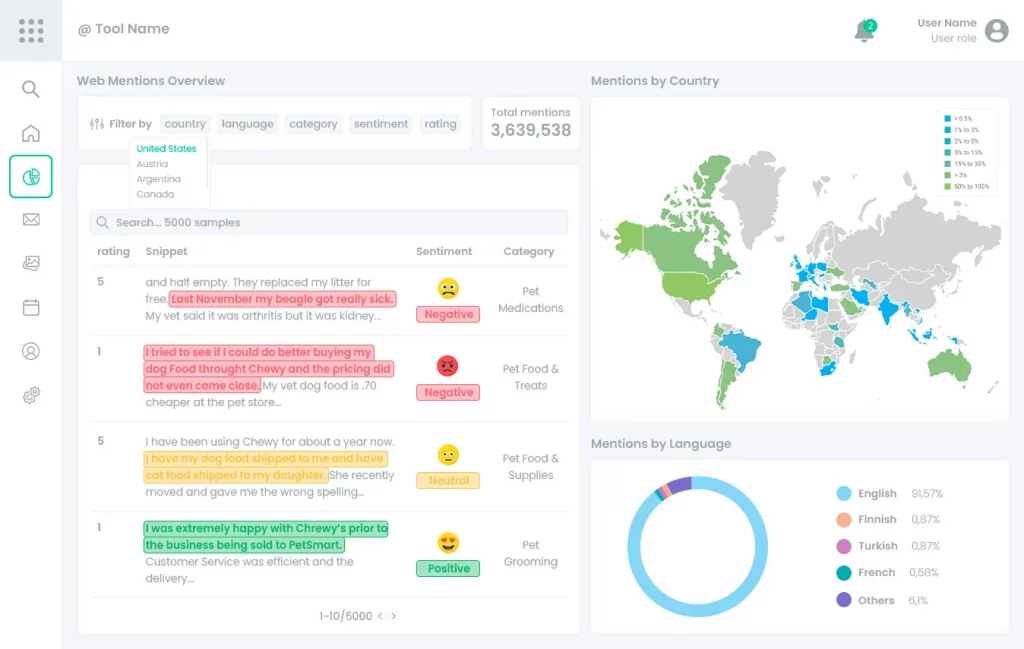
This handy dashboard provides users with a stream of valuable web mentions data in an organized way. Besides the details of each web mention, such as content snippet and sentiment, this view also offers citation stats broken down by country and content language.
In order to build this informative report, you’ll only need to use two endpoints from the DataForSEO Content Analysis API: Search and Summary.
Components
Web Mentions Overview
A quality overview of web mentions gives users all key details about the mentions of the target keywords they entered. Advanced Filters by sentiment, country & more, allow users to cut through the noise and focus on what matters.
You can create this feature atop the Content Analysis API – Search endpoint.
If you’d like the results to appear in a certain order (e.g. from most negative to most positive mentions), specify the order_by parameter accordingly.

Use the filters parameter in the body of your POST request to the Search endpoint to filter the results by country, sentiment polarity (e.g. negative), etc.
        # Instead of 'login' and 'password' use your credentials from https://app.dataforseo.com/api-dashboard
        login="login"
        password="password"
        cred="$(printf ${login}:${password} | base64)"
        curl --location --request POST "https://api.dataforseo.com/v3/content_analysis/search/live"
        --header "Authorization: Basic ${cred}"
        --header "Content-Type: application/json"
        --data-raw "
        [
          {
            "keyword": "logitech",
            "filters": [
              "main_domain",
              "=",
              "reviewfinder.ca"
            ],
            "order_by": [
              "content_info.sentiment_connotations.anger,desc"
            ],
            "limit": 5
          }
        ]"


Mentions by Country
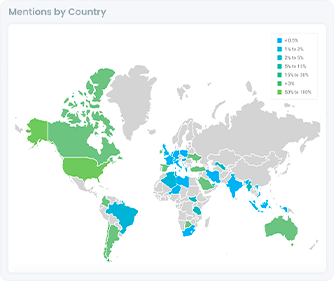
The map view highlights which countries mention the user’s target keywords more. The closer to the green shade, the more mentions a user gets from the domain registered in the respective country. The countries in grey are those mentioning no target keywords.
You can implement this feature by using data from the Content Analysis API – Summary endpoint.
Note that to obtain the maximum number of countries that mention your target keywords, you should set the internal_list_limit parameter to 20 (max value) in the body of your POST request.
        # Instead of 'login' and 'password' use your credentials from https://app.dataforseo.com/api-dashboard
        login="login"
        password="password"
        cred="$(printf ${login}:${password} | base64)"
        curl --location --request POST "https://api.dataforseo.com/v3/content_analysis/summary/live"
        --header "Authorization: Basic ${cred}"
        --header "Content-Type: application/json"
        --data-raw "[
          {
            "keyword": "logitech",
            "internal_list_limit": 20
          }
        ]"
Use the number from the total_count field of the API response as 100% of mentions for the map. If you need data on several keywords, make separate API calls, and calculate 100% as the sum of numbers from the total_count of API response for each keyword.
To display the distribution of mentions by country, take data from the countries object. If needed, sum up the number of mentions per country for all monitored keywords. For example, if you get 10 mentions of keyword1 and 20 mentions of keyword2 from the US, you should display 30 as the number of mentions from the US in total.
Mentions by Language
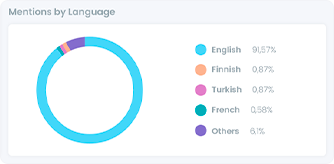
This pie chart gives users a peek into the languages most frequently used to cite their target keywords.
Similarly to the previous feature, data for this chart can be found in the responses of the Content Analysis API – Summary endpoint.
If you’d like to display both Mentions by Country and Mentions by Language, you don’t need to make separate API calls to get data for this pie chart.
Simply use data from the languages object of the same response(s), and calculate the percentages in the same way as we previously explained.
If you want to build the pie chart only, note that you should set the internal_list_limit parameter to 20 (max value) when making a POST request to the Summary endpoint. This will ensure you obtain the maximum number of languages used to mention your target keywords.
        # Instead of 'login' and 'password' use your credentials from https://app.dataforseo.com/api-dashboard
        login="login"
        password="password"
        cred="$(printf ${login}:${password} | base64)"
        curl --location --request POST "https://api.dataforseo.com/v3/content_analysis/summary/live"
        --header "Authorization: Basic ${cred}"
        --header "Content-Type: application/json"
        --data-raw "[
          {
            "keyword": "logitech",
            "internal_list_limit": 20
          }
        ]"
Sentiment Overview
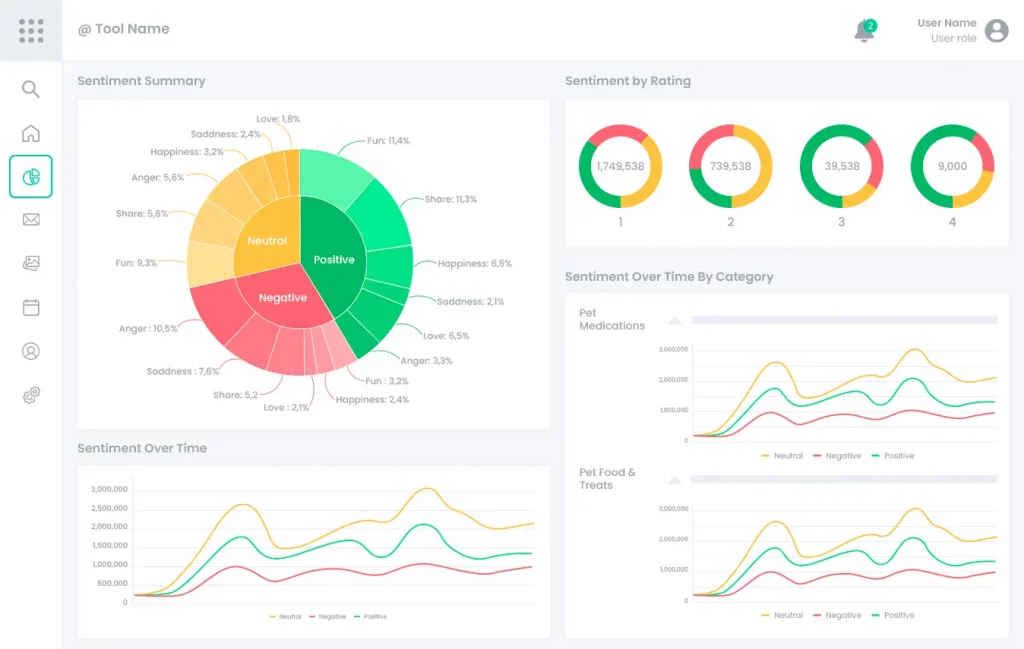
This part of the dashboard reveals a full 360 view of how customers and stakeholders view a user’s brand, product, or company. Sentiment stats presented in this report can reveal critical insights about what a business is doing right or wrong.
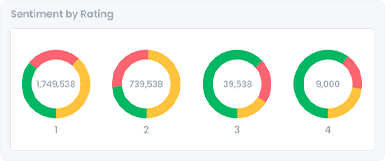
From detailed Sentiment distribution by emotions and rating to sentiment trend timeline – all of the features in this dashboard can be based on the following endpoints of DataForSEO Content Analysis API: Sentiment Analysis, Phrase Trends, and Rating Distribution.
Components
Sentiment Summary
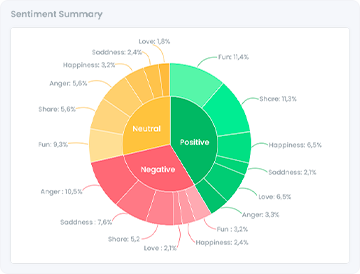
The key element of this dashboard - Sentiment Summary - communicates detailed brand reputation through a wheel chart. Relying on this visualization, users can conveniently observe the correlation between the number of positive, negative, and neutral mentions, while also diving into the distribution of mentions by emotions within each polarity.
At the same time, you can fully rely on the Sentiment Analysis endpoint of our API to build this chart.
        # Instead of 'login' and 'password' use your credentials from https://app.dataforseo.com/api-dashboard
        login="login"
        password="password"
        cred="$(printf ${login}:${password} | base64)"
        curl --location --request POST "https://api.dataforseo.com/v3/content_analysis/sentiment_analysis/live"
        --header "Authorization: Basic ${cred}"
        --header "Content-Type: application/json"
        --data-raw "[
          {
            "keyword": "logitech"
          }
        ]"
{
  "version": "0.1.20220819",
  "status_code": 20000,
  "status_message": "Ok.",
  "time": "23.0121 sec.",
  "cost": 0.02003,
  "tasks_count": 1,
  "tasks_error": 0,
  "tasks": [
    {
      "id": "11091707-1535-0465-0000-07fd1ba1463b",
      "status_code": 20000,
      "status_message": "Ok.",
      "time": "22.9506 sec.",
      "cost": 0.02003,
      "result_count": 1,
      "path": [...],
      "data": {...},
      "result": [
        {
          "type": "content_analysis_sentiment_analysis",
          "positive_connotation_distribution": {
            "positive": {...},
            "negative": {...},
            "neutral": {
              "type": "content_analysis_summary",
              "total_count": 2854419,
              "rank": 638,
              "top_domains": [...],
              "sentiment_connotations": {
                "anger": 48,
                "happiness": 72433,
                "love": 2073,
                "sadness": 757,
                "share": 90082,
                "fun": 2248
              },
              "connotation_types": {...},
              "text_categories": [...],
              "page_categories": [...],
              "page_types": {...},
              "countries": {...},
              "languages": {...}
            }
          },
          "sentiment_connotation_distribution": {...}
        }
      ]
    }
  ]
}
Note that in case you should combine data for several keywords, you’ll need to calculate the sum of relevant total_count fields, and the sum of mentions with each relevant emotion for all keywords.
Let’s say, you monitor two keywords. Keyword1 has 10 positive mentions, 5 of which reflect happiness, while keyword2 has 15 positive mentions, 9 of which reflect happiness. In this case, the positive area of your chart should represent 10+15=25 mentions, and the happiness part of it should represent 5+9=14 mentions.
        # Instead of 'login' and 'password' use your credentials from https://app.dataforseo.com/api-dashboard
        login="login"
        password="password"
        cred="$(printf ${login}:${password} | base64)"
        curl --location --request POST "https://api.dataforseo.com/v3/content_analysis/rating_distribution/live"
        --header "Authorization: Basic ${cred}"
        --header "Content-Type: application/json"
        --data-raw "[
          {
            "keyword": "logitech",
            "search_mode": "as_is"
            "internal_list_limit": 10
          }
        ]"
Sentiment Over Time
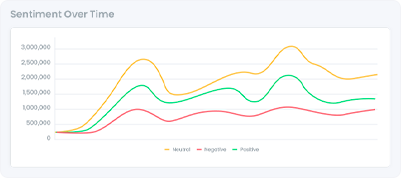
The Sentiment Over Time graph plots the proportion and fluctuations of positive, neutral, and negative sentiment in a user’s mentions over the indicated date range.
Keeping tabs on this graph is a convenient way to track the audience’s attitude toward a brand or product and investigate when it started improving or deteriorating.
        # Instead of 'login' and 'password' use your credentials from https://app.dataforseo.com/api-dashboard
        login="login"
        password="password"
        cred="$(printf ${login}:${password} | base64)"
        curl --location --request POST "https://api.dataforseo.com/v3/content_analysis/phrase_trends/live"
        --header "Authorization: Basic ${cred}"
        --header "Content-Type: application/json"
        --data-raw "[
          {
            "keyword": "logitech",
            "date_from": "2022-09-01",
            "date_group": "month"
          }
        ]"
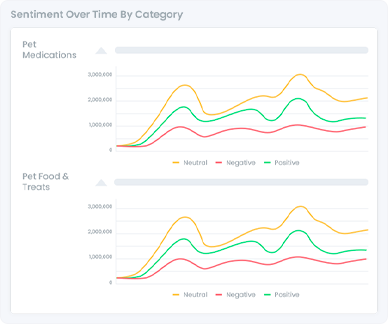
Sentiment Over Time by Category
Similarly to the previous feature, this visualization plots the sentiment polarity over time. Yet, here, users will see the overall trend in the selected category(-ies).
Given this, Sentiment Over Time By Category presents users with an opportunity to inspect market trends and compare their progress with the prevailing sentiment in their target category.
To offer this feature, incorporate the Category Trends endpoint of Content Analysis API.
When making an API call, use data from the Category Input in the body of your POST request. Note that you’ll need to indicate category codes, not names. For each separate category, make a new API request.
        # Instead of 'login' and 'password' use your credentials from https://app.dataforseo.com/api-dashboard
        login="login"
        password="password"
        cred="$(printf ${login}:${password} | base64)"
        curl --location --request POST "https://api.dataforseo.com/v3/content_analysis/category_trends/live"
        --header "Authorization: Basic ${cred}"
        --header "Content-Type: application/json"
        --data-raw "[
          {
            "category_code": 10994,
            "date_from": "2022-09-01",
            "date_group": "month"
          }
        ]"
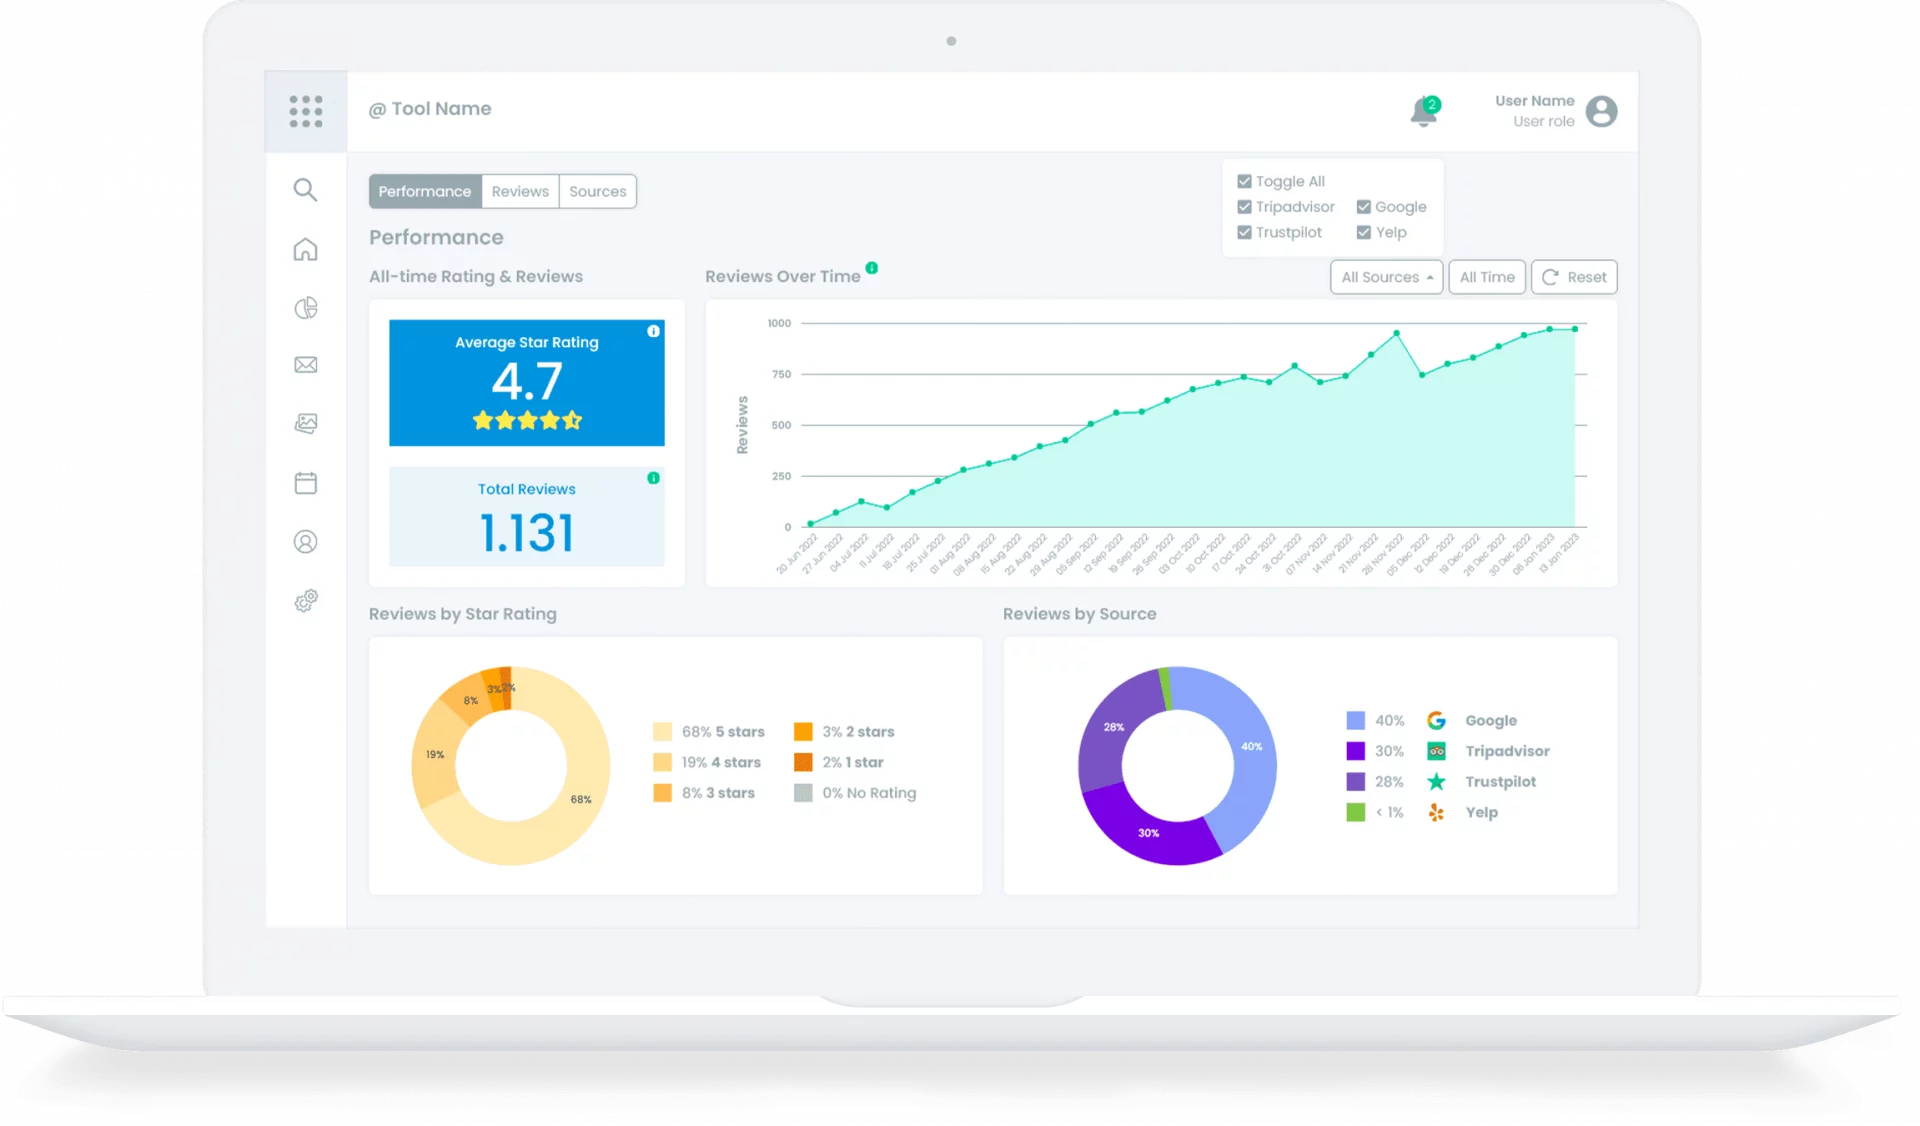
Review Monitoring
Review monitoring tools offer a range of features that help businesses keep track of customer feedback, assess client needs, and maintain an impeccable online reputation. This guide will give you precise instructions for building review monitoring features based on Reviews API from DataForSEO.
Content Analysis API
Content Analysis API will ensure your brand monitoring solution can quickly search for brand mentions and keyword citations across the web and get all the related data in real-time. It also provides a sophisticated sentiment analysis algorithm that can be easily integrated into your solution.


