Stocks box
Stocks box
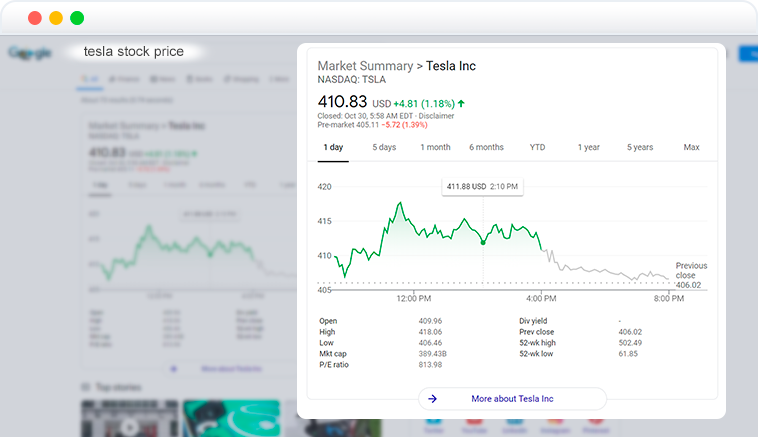
Stocks box feature on Google SERP displays a market summary from Google Finance for a particular company. This feature usually appears in the results for queries that contain a company name or a trading symbol and, but not necessarily, words related to stock market and trading activities.
Note that Google provides some financial information with a delay according to Google Finance disclaimer.
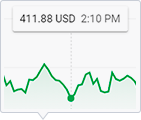
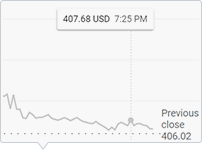
In DataForSEO API responses, you will find the data provided for each point on the graph as structured items – “graph_element”. If there is any additional information below the graph, you will find it in the “table_content” array of our API response.

Title | title

Source | source

Price | price

Table content | table_content

Items | graph_element

Previous close data | previous_items

Element in SERP API
{
    "type":"stocks_box",
    "rank_group": 1,
    "rank_absolute": 1,
    "position":"left",
    "xpath": "/html[1]/body[1]/div[7]/div[2]/div[10]/div[1]/div[2]/div[1]/div[2]/div[2]/div[1]/div[1]/div[1]",
    "title": "Market Summary > Tesla Inc",
    "source":"NASDAQ: TSLA",
    "snippet":"Pre-market After hours В 405.11 В в€’5.72 (1.39%)",
    "price":"410.83 USD",
    "url": "https://www.google.com/finance?num=100&hl=en&gl=US&gws_rd=cr&ie=UTF-8&oe=UTF-8&uule=w+CAIQIFISCQs2MuSEtepUEUK33kOSuTsc&sa=X&ved=2ahUKEwjAuJieh9zsAhV463MBHU0RBdoQ6M8CMAB6BAhfEAQ",
    "domain":"www.google.com",
    "rectangle": null,
    "table":{
        "table_header": null,
        "table_content":[
            [
                "Open",
                "409.96"
            ],
            [
                "High",
                "418.06"
            ],
            [
                "Low",
                "406.46"
            ],
            [
                "Mkt cap",
                "389.43B"
            ],
            [
                "P/E ratio",
                "813.98"
            ],
            [
                "Div yield",
                "-"
            ],
            [
                "Prev close",
                "406.02"
            ],
            [
                "52-wk high",
                "502.49"
            ],
            [
                "52-wk low",
                "61.85"
            ]
        ]
    },
    "graph":{
        "items":[
            {
                "type":"graph_element",
                "date":"2020-10-29T09:30:00",
                "value": 409.94
            },
            {
                "type":"graph_element",
                "date":"2020-10-29T09:35:00",
                "value": 409.76
            },
            {
                "type":"graph_element",
                "date":"2020-10-29T09:40:00",
                "value": 408.39
            },
            {
                "type":"graph_element",
                "date":"2020-10-29T09:45:00",
                "value": 408.645
            },
            {
                "type":"graph_element",
                "date":"2020-10-29T09:50:00",
                "value": 406.9501
            },
            {
                "type":"graph_element",
                "date":"2020-10-29T09:55:00",
                "value": 408.16
            },
            {
                "type":"graph_element",
                "date":"2020-10-29T10:00:00",
                "value": 408.77
            },
            {
                "type":"graph_element",
                "date":"2020-10-29T10:05:00",
                "value": 410.92
            },
            {
                "type":"graph_element",
                "date":"2020-10-29T10:10:00",
                "value": 410.89
            },
            {
                "type":"graph_element",
                "date":"2020-10-29T10:15:00",
                "value": 410.46
            }
        ],
        "previous_items":[
            {
                "type":"graph_element",
                "date":"2020-10-29T16:00:00",
                "value": 410.83
            },
            {
                "type":"graph_element",
                "date":"2020-10-29T16:05:00",
                "value": 410.57
            },
            {
                "type":"graph_element",
                "date":"2020-10-29T16:10:00",
                "value": 410.83
            },
            {
                "type":"graph_element",
                "date":"2020-10-29T16:15:00",
                "value": 409.04
            },
            {
                "type":"graph_element",
                "date":"2020-10-29T16:20:00",
                "value": 410.78
            },
            {
                "type":"graph_element",
                "date":"2020-10-29T16:25:00",
                "value": 409
            },
            {
                "type":"graph_element",
                "date":"2020-10-29T16:30:00",
                "value": 409
            },
            {
                "type":"graph_element",
                "date":"2020-10-29T16:35:00",
                "value": 407.94
            },
            {
                "type":"graph_element",
                "date":"2020-10-29T16:40:00",
                "value": 407.88
            },
            {
                "type":"graph_element",
                "date":"2020-10-29T16:45:00",
                "value": 408.6
            }
        ]
    }
}

