
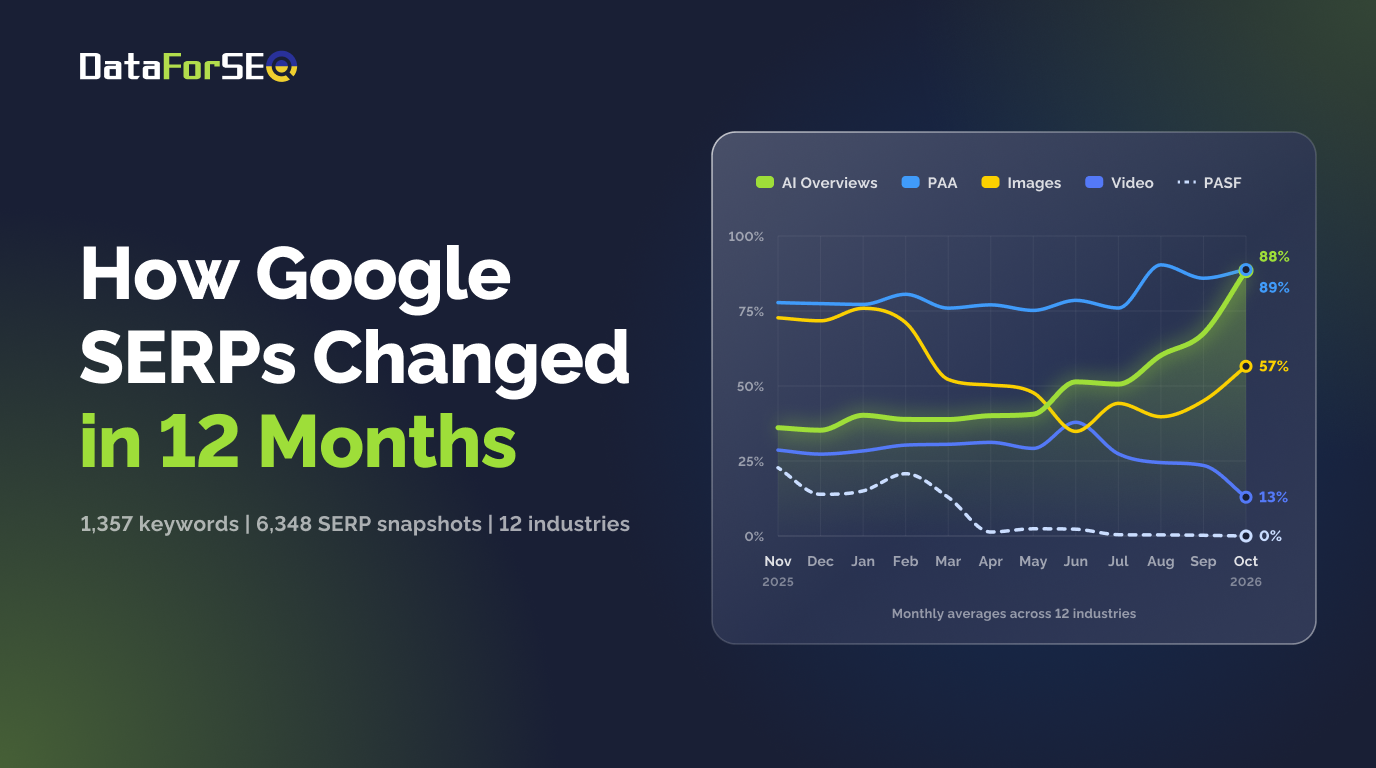
We analyzed 1,357 keywords across 12 industries to see how Google’s search results changed over the last 12 months, and how much the results page depends on what people search for.
A Google search results page (SERP) can hold multiple features that increasingly compete for our attention. AI-generated answers, People Also Ask (PAA) boxes, Popular Products, Videos, Images, Reviews, and Local Packs all create a different search experience and it’s changing fast. But not in the same way across industries.
For example, AIOs now appear for three-quarters of Finance keywords, but fewer than four in ten Real Estate queries. Home and Garden results are rich in visuals and products, while Travel searches lean heavily on PAA and destination-specific features like Hotels.
But how is this mix changing over time? As AI Overviews spread, are older SERP features fading? Are Images and Videos being crowded out? And are all industries following the same trends?
To find out, we analyzed 6,348 historical SERP snapshots covering 1,357 keywords across 12 industries in the US English-language search, from November 2025 through October 2026. We used the latest snapshot of each keyword to identify its industry’s current SERP fingerprint, then investigated historical observations to see which features were gaining or losing ground.
The headline finding: AI Overviews grew in every industry we explored. Meanwhile, Images and People Also Search For (PASF) became less common, and PAA held up well. Yet, despite these broader trends, Google’s results pages remain remarkably different from one industry to another.
Data source. Every number in the present study comes from DataForSEO’s historical Google SERPs database — the same per-keyword SERP history that powers the Historical SERPs endpoint in DataForSEO Labs API.
Current SERP Feature Fingerprints Across 12 Industries
To understand how Google’s results are evolving, we first need to understand what they look like today.
Our data indicates that two features show up almost everywhere. Related Searches appear on 87% to 97% of keywords in every industry, and People Also Ask on 79% or more everywhere except Real Estate (55%). The differences between industries come from everything else on the page. A Finance results page averages 3.3 tracked features, with Images on 22% of keywords and Popular Products on 1%. Beauty & Personal Care and Home & Garden average 4.4, with Images on about two-thirds of SERPs and Popular Products on 41% and 48%. We call an industry’s typical mix of features its SERP fingerprint.
The chart shows 10 of the 32 SERP features we track with a few rare industry-specific feature notes. The findings are based on the latest snapshot for each keyword as of October 2026. Each percentage is the share of sampled keywords whose SERP showed that feature. One results page can show several features, so the percentages in a row don’t add up to 100%.
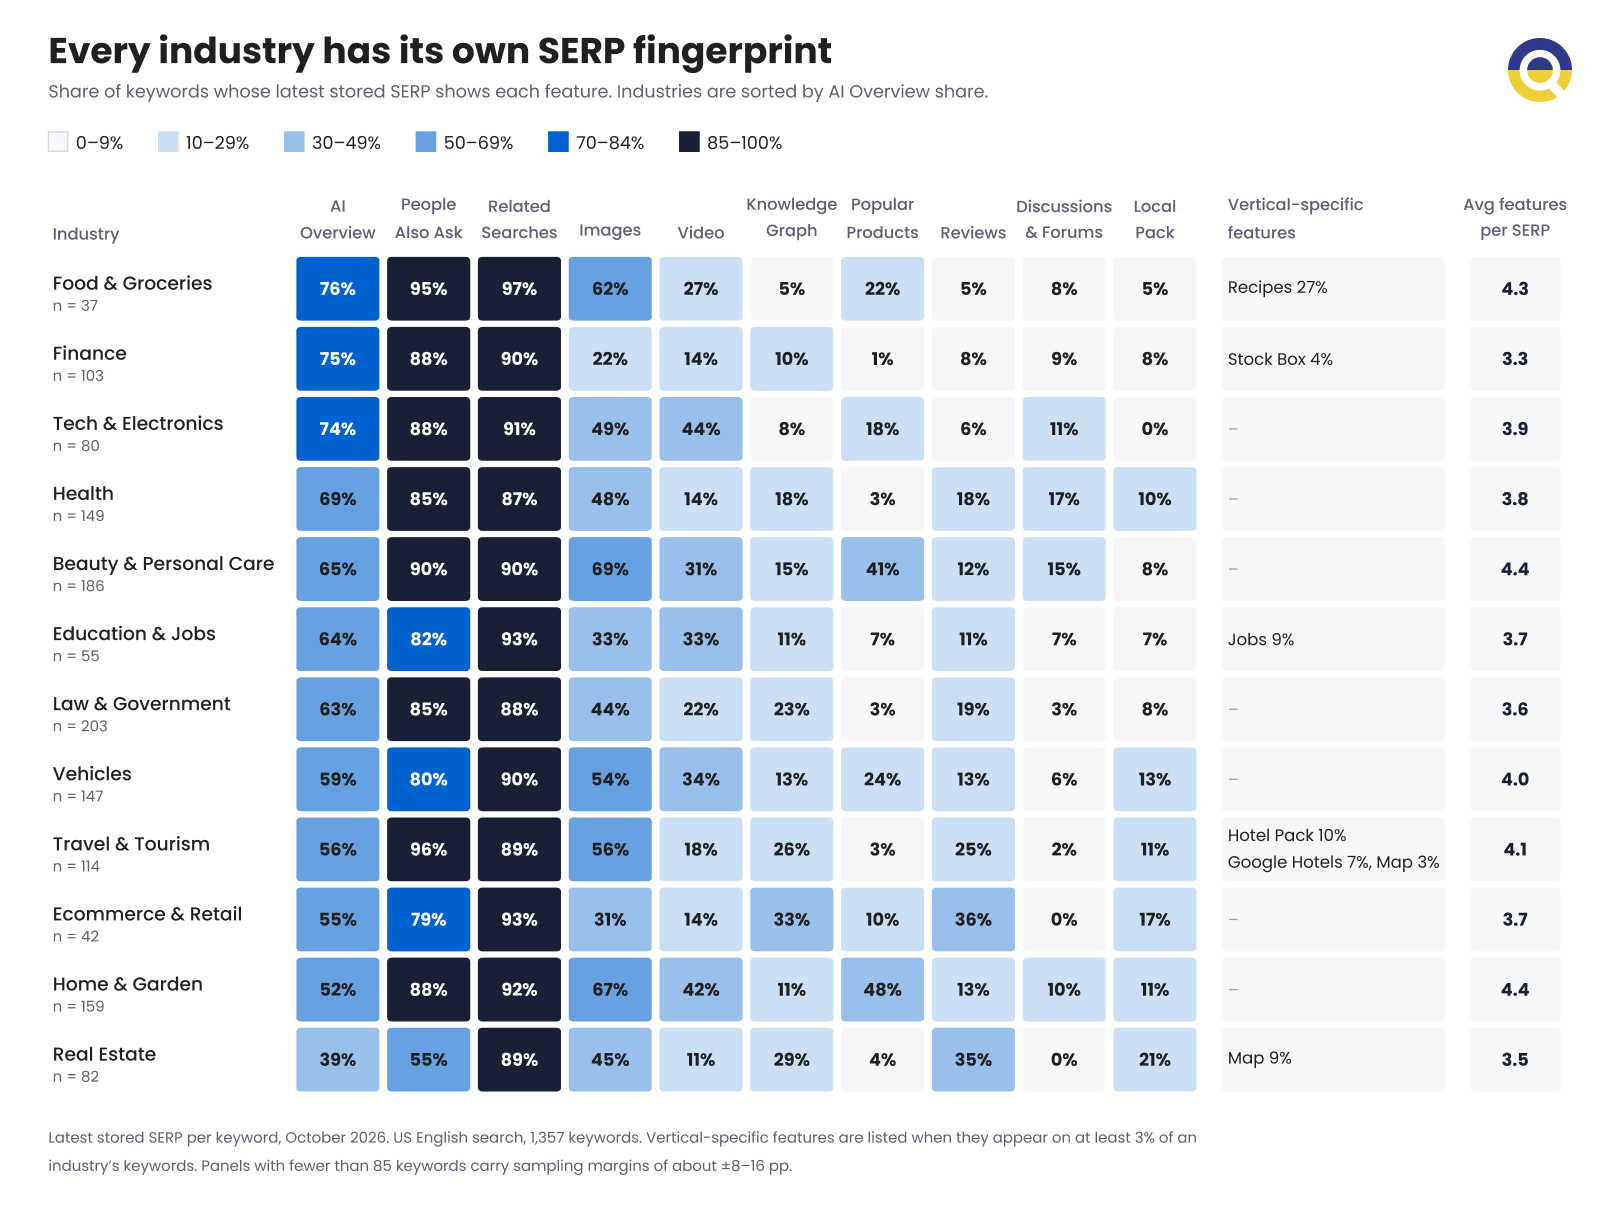
Note: Current fingerprint is the latest available stored SERP for each keyword. Percentages are rounded to whole numbers, except small nonzero Featured snippet values, so some zeros elsewhere are rounded-down values. “Keywords (n)” is the industry sample size, and the last column is the average number of tracked features per SERP, counted across all 32 tracked features, including those not shown in the table as they were not present or had nearly 0% presence across all industries in the sample.
The overall figures reveal some clear patterns, but each industry has its own standouts. Let’s take a closer look.
An AI-heavy SERP Doesn’t Look The Same In Every Industry
AI Overviews are most common in Food & Groceries (76%), Finance (75%), and Tech & Electronics (74%). Beyond that one feature, the three have little in common.
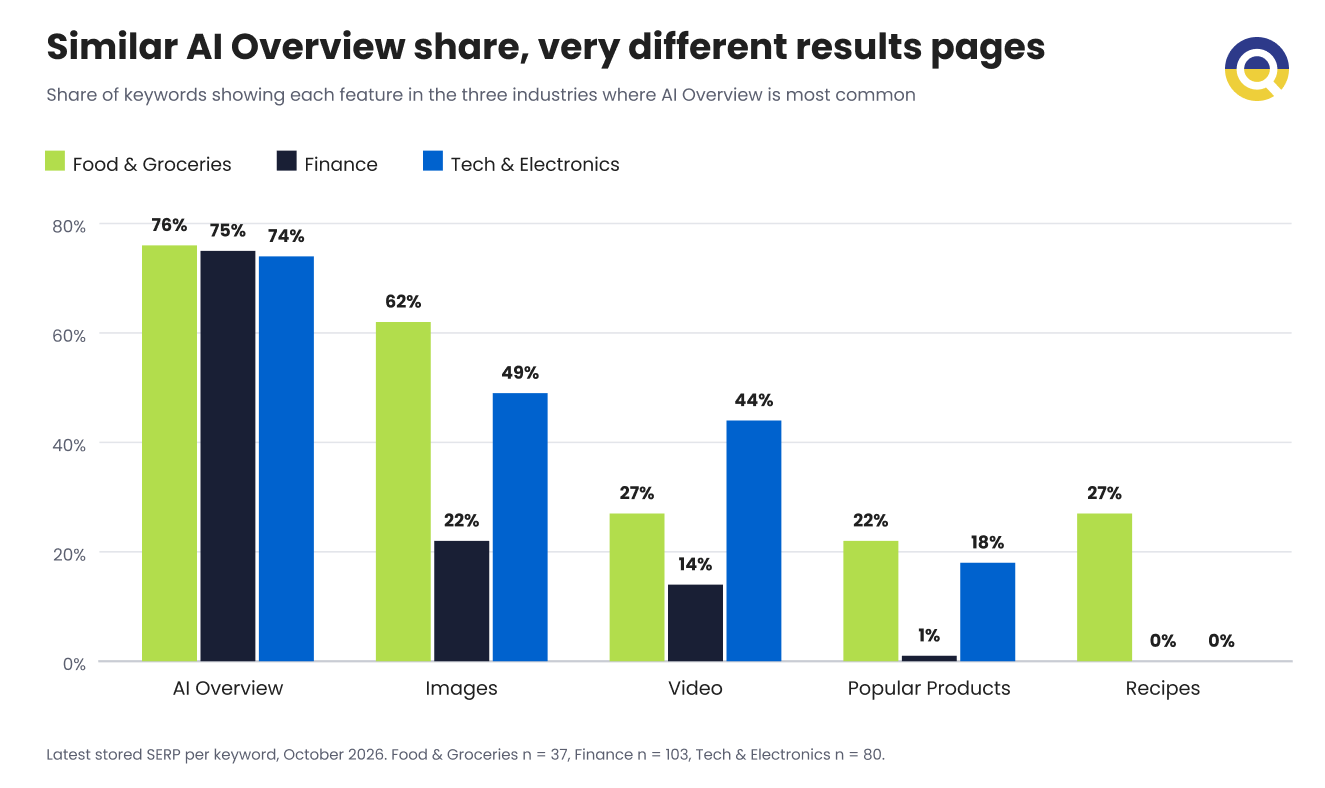
Finance has the sparsest results pages in the study, averaging 3.3 tracked features per SERP. Images appear on 22% of its sampled keywords, Videos on 14%, and Popular Products on 1%. Most of what Finance searchers see is informational content, with few products or media.
Food & Groceries is close to the opposite. Along with its high AI Overview share, it has Images on 62% of sample results and Recipes on 27%. Tech & Electronics stands out for Video, which appears for 44% of its SERPs, the highest rate in the sample. Popular Products show up on 18%.
Where Images And Shopping Stand Out
Beauty & Personal Care and Home & Garden are heavy on visual and shopping features. Images appear on 69% of Beauty & Personal Care SERPs and 67% of Home & Garden SERPs, and Popular Products on 41% and 48% respectively. That 48% is the highest Popular Products rate in the study.
They are also two of the busiest results pages we saw, at about 4.4 features per page, mixing answers, questions, images, videos, and shopping elements.
Vehicles has a similar mix in different proportions: Images on 54% of SERPs, Videos on 34%, and Popular Products on 24%.
Travel, Local Search, And Reviews
In Travel & Tourism, People Also Ask appears on 96% of keywords, more than in any other industry. Destination information is common too: Reviews appear for 25% of keywords, Hotel Packs for 10%, and Google Hotels for 7%. Knowledge Graphs show up on 26% of the analyzed results pages.
Real Estate has the lowest AI Overview share in the study at 39%, and the highest Local Pack share of any industry at 21%. Reviews (35%) and Knowledge Graphs (29%) are also common.
Ecommerce & Retail leans on Reviews in a similar way. They appear for 36% of its sampled keywords, the highest share of any industry, and Knowledge Graphs appear on 33%.
Smaller, Industry-Specific Features
Some SERP features are specialized enough to get lost in cross-industry summaries. In particular, Job Listings appear on 9% of Education & Jobs keywords, Stock Boxes on 4% of Finance keywords, and Health has Discussions & Forums on 17% and Reviews on 18%. Traditional Featured Snippets are nearly absent, appearing on no more than 2% of keywords in any industry.
Which SERP Features Are Rising And Which Are Declining
To see how Google’s results have changed, we compared the earliest and latest available SERP snapshots for the same keywords. We selected features that showed the clearest increases, most consistent declines, or interesting differences between industries.
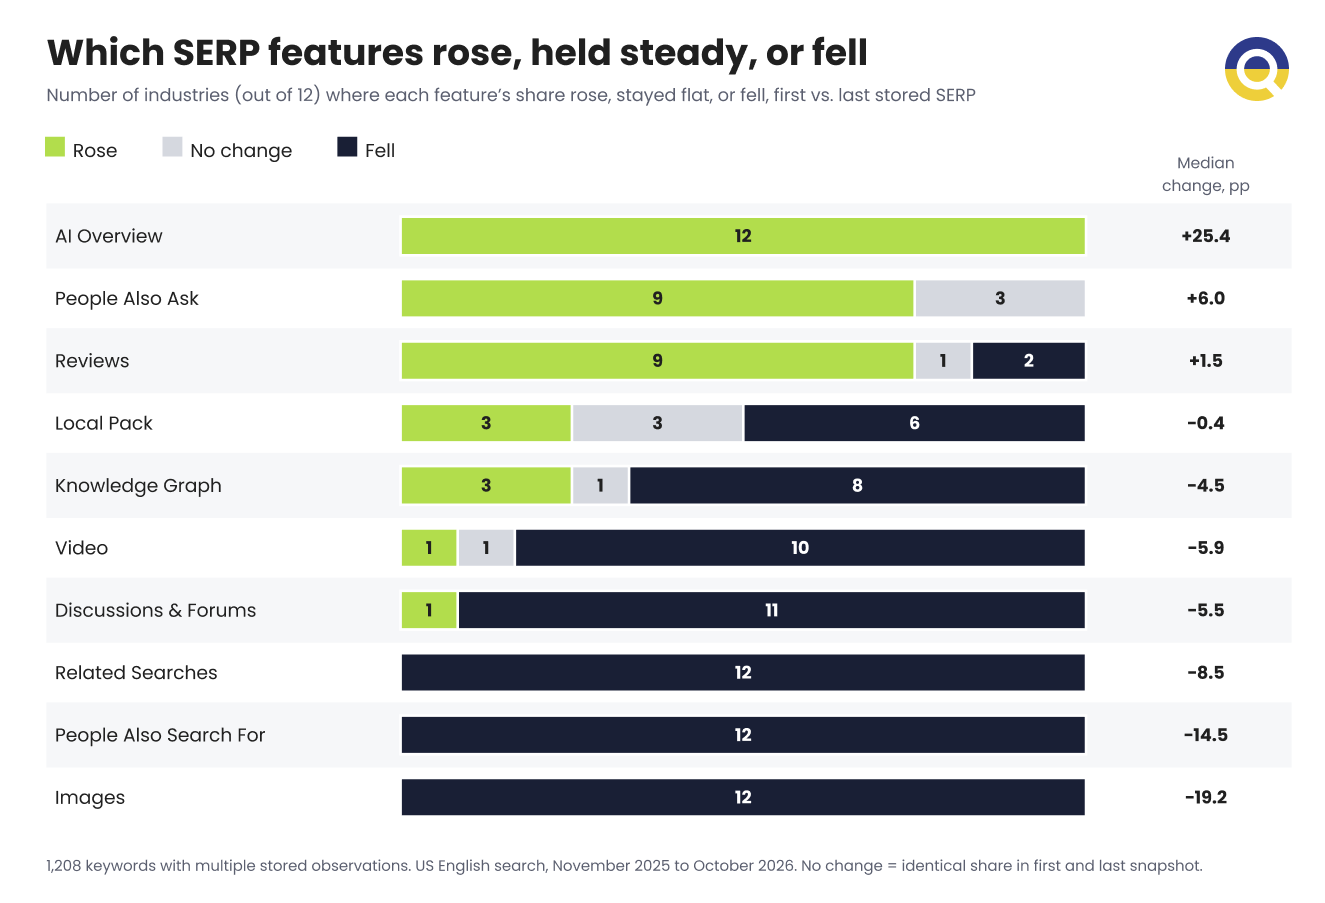
Three patterns stand out. AI Overviews gained visibility in every industry, increasing by between 16.7 and 41.8 percentage points. Images and People Also Search For moved in the opposite direction, declining across all 12 industries. People Also Ask proved more resilient, increasing in nine industries and holding steady in the other three.
| Industry | AIO | PAA | Reviews | Local Pack | Knowledge Graph | Video | Discussions & Forums | Related searches | PASF | Images |
| Food & Groceries | +25.8 | 0.0 | +3.2 | -3.2 | -6.5 | -6.5 | -6.5 | -3.2 | -16.1 | -19.4 |
| Finance | +24.7 | +1.1 | +1.1 | +2.2 | -4.5 | +1.1 | -6.7 | -7.9 | -10.1 | -14.6 |
| Tech & Electronics | +41.8 | +20.9 | -3.0 | 0.0 | -6.0 | -6.0 | -4.5 | -9.0 | -13.4 | -19.4 |
| Health | +16.7 | 0.0 | -0.8 | -0.8 | -7.6 | 0.0 | -5.3 | -7.6 | -5.3 | -18.9 |
| Beauty & Personal Care | +31.5 | +3.6 | +0.6 | 0.0 | +0.6 | -6.0 | -19.0 | -8.9 | -15.5 | -16.7 |
| Education & Jobs | +25.0 | +6.2 | +2.1 | 0.0 | -8.3 | -6.2 | +2.1 | -8.3 | -16.7 | -35.4 |
| Law & Government | +22.1 | +8.9 | +3.2 | -1.1 | -1.1 | -5.8 | -1.1 | -7.9 | -6.3 | -27.4 |
| Vehicles | +27.0 | +10.3 | +4.8 | -2.4 | +4.0 | -8.7 | -11.1 | -7.1 | -12.7 | -21.4 |
| Travel & Tourism | +21.6 | +14.4 | +1.8 | -0.9 | -4.5 | -0.9 | -6.3 | -9.0 | -37.8 | -16.2 |
| Ecommerce & Retail | +34.3 | 0.0 | +5.7 | -2.9 | 0.0 | -11.4 | -2.9 | -8.6 | -11.4 | -31.4 |
| Home & Garden | +19.9 | +11.3 | +0.7 | +1.4 | -5.0 | -3.5 | -5.7 | -9.2 | -23.4 | -17.7 |
| Real Estate | +31.4 | +5.7 | 0.0 | +1.4 | +2.9 | -1.4 | -1.4 | -10.0 | -25.7 | -10.0 |
Note: The figures in the table are based on the subset of 1,208 keywords with at least two stored snapshots (excluding 149 single-snapshot keywords from the panel). The median observation gap between snapshots was approximately nine months. All figures represent a change in percentage points (pp): the difference in the share of SERPs showing a particular feature, not relative growth rates.
While the main trends are clear, let’s consider the most interesting cases in more detail to understand the changes better.
1. AI Overviews Have Risen In All 12 Industries, Images Declined Everywhere
AI Overviews gained visibility across all 12 industries, but the scale of the increase varied. Tech & Electronics had the biggest jump, +41.8 percentage points, taking AIOs from 41.8% to 83.6% of SERPs. Ecommerce & Retail followed at +34.3 points. Beauty & Personal Care gained +31.5 points, and Real Estate gained +31.4.
Real Estate is an interesting case. AI Overviews went from around 9% to 40% of SERPs, meaning their presence increased more than fourfold. Despite this sharp increase, Real Estate still has the lowest AIO share in the separate current snapshot, so fast growth hasn’t brought every industry to the same level.
Health had the smallest increase, +16.7 points, though AI Overviews were already fairly common in Health at the beginning of the comparison period.
In contrast, the Images feature became less common across all 12 industries.
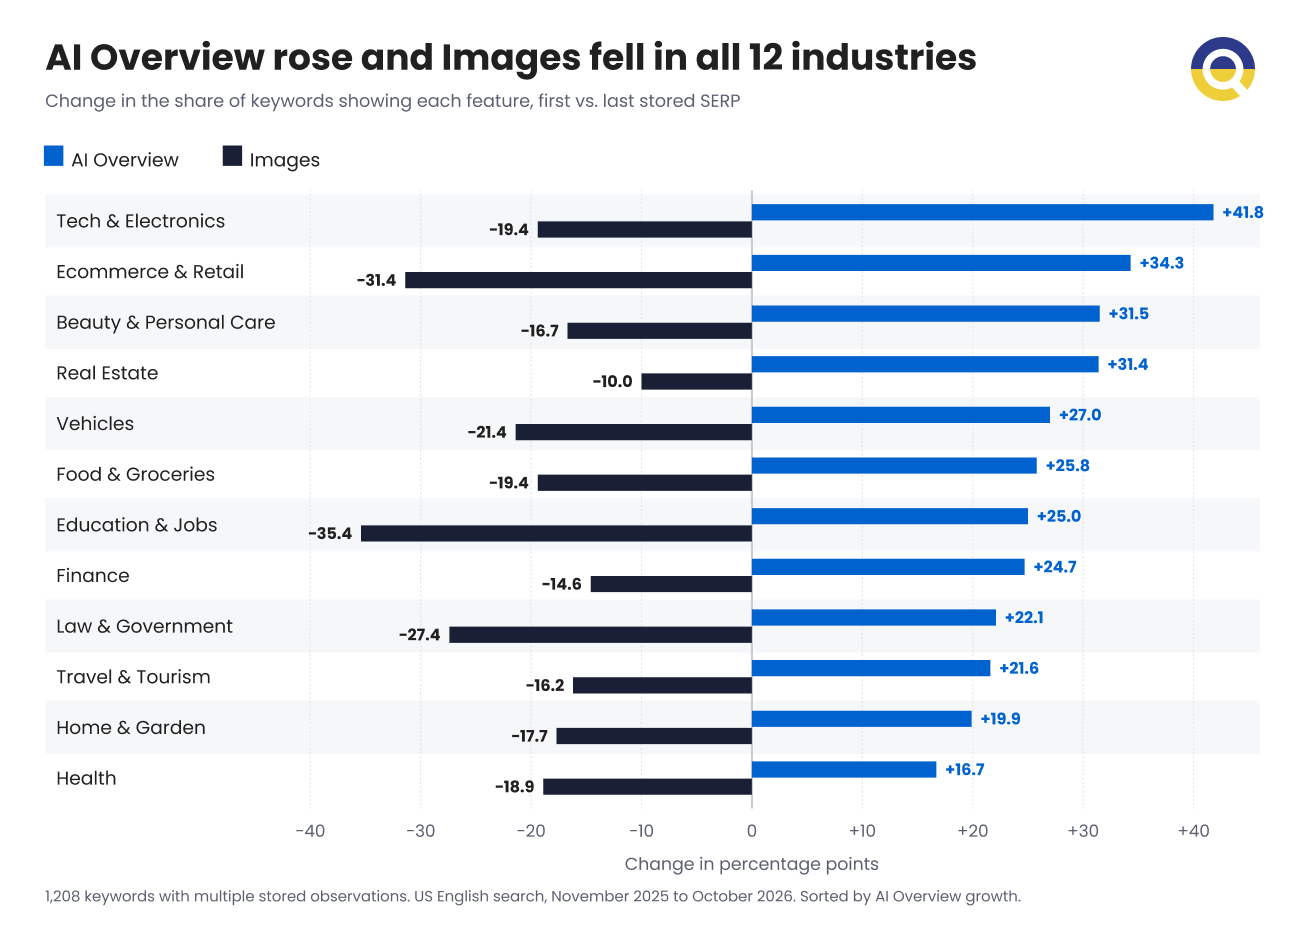
Education & Jobs saw the steepest drop at -35.4 points, followed by Ecommerce & Retail at -31.4 and Law & Government at -27.4. Industries closely tied to visual content declined too: Beauty & Personal Care lost -16.7 points, Home & Garden -17.7, and Food & Groceries -19.4.
However, this doesn’t mean pictures have become less valuable in search. The Images feature still appears on roughly two-thirds of SERPs in Beauty & Personal Care and Home & Garden. And while their decline happened over the same period that AI Overviews gained visibility, this dataset doesn’t establish a causal link between the two.
2. PAA is Growing, While Reviews Edged Up in Most Industries
It might seem logical to assume that AI-generated answers are replacing Google’s traditional question-and-answer features. However, the data suggests that both can coexist in search results.
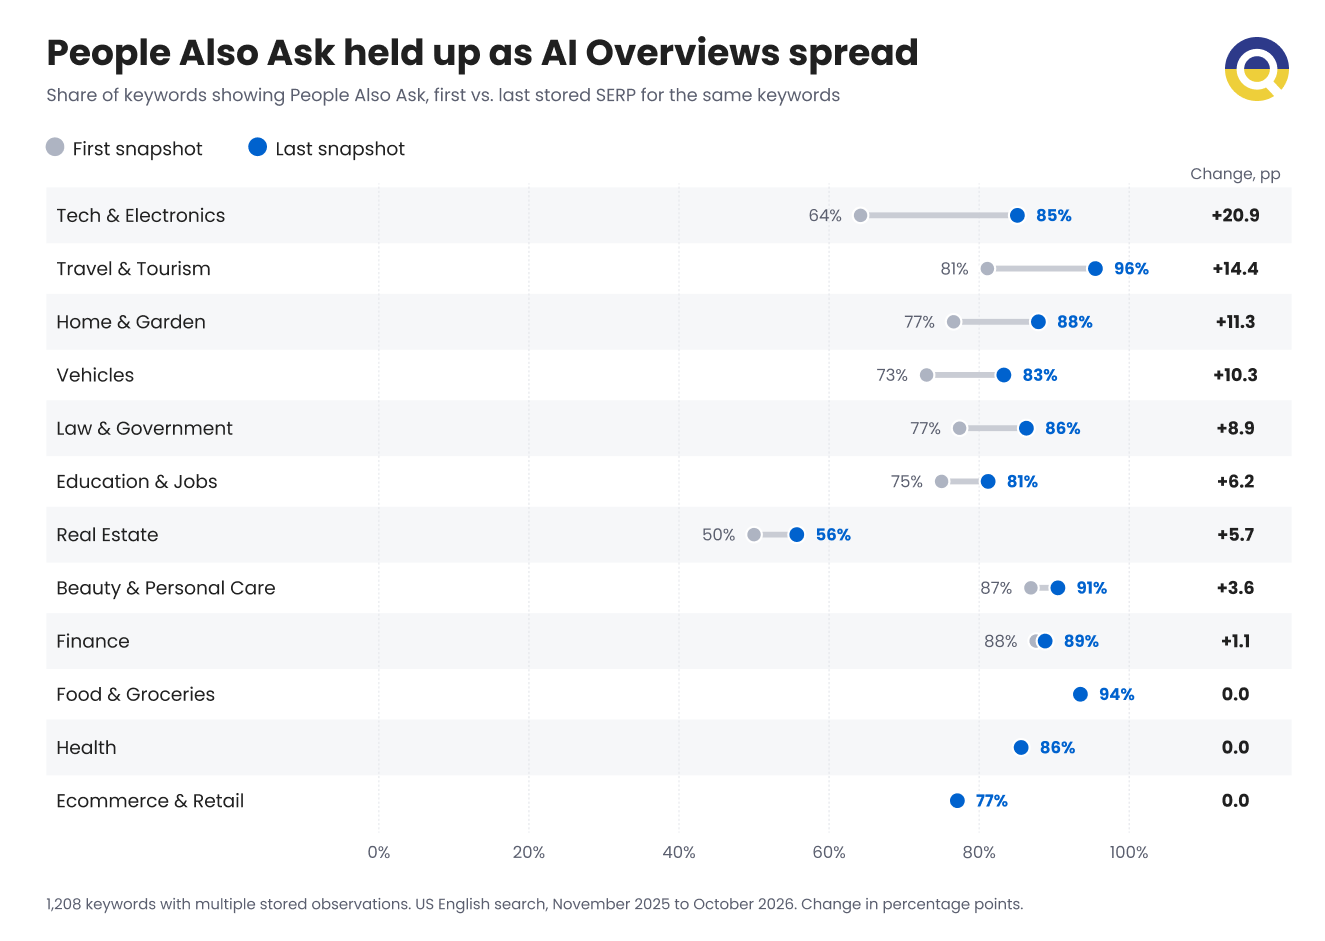
People Also Ask increased in nine industries and held steady in the other three. Tech & Electronics saw the largest increase, +20.9 percentage points, followed by Travel & Tourism at +14.4 points and Home & Garden at +11.3 points.
This suggests that AI Overviews aren’t necessarily pushing other question-based features out of SERPs. One results page can carry both an AI-generated answer and a set of related questions. For content teams, that means there’s still value in addressing the surrounding questions, the ones people ask before, during, and after their first search.
Meanwhile, Reviews also increased in nine industries, although by much smaller amounts. Ecommerce & Retail had the largest gain at +5.7 points, followed by Vehicles at +4.8. Those changes are worth watching, but they’re nowhere near the scale of AI Overview growth.
3. PASF Is Fading, But Related Searches Remains Widespread
People Also Search For declined in all 12 industries, with some particularly sharp drops. Travel & Tourism saw the largest decrease, -37.8 percentage points, followed by Real Estate at -25.7 points and Home & Garden at -23.4.
The trend of a similar SERP feature – Related Searches – tells a different story. It also fell in every industry, but only by 3.2 to 10.0 points, and it still appears on 87%-97% of keywords in the latest snapshots.
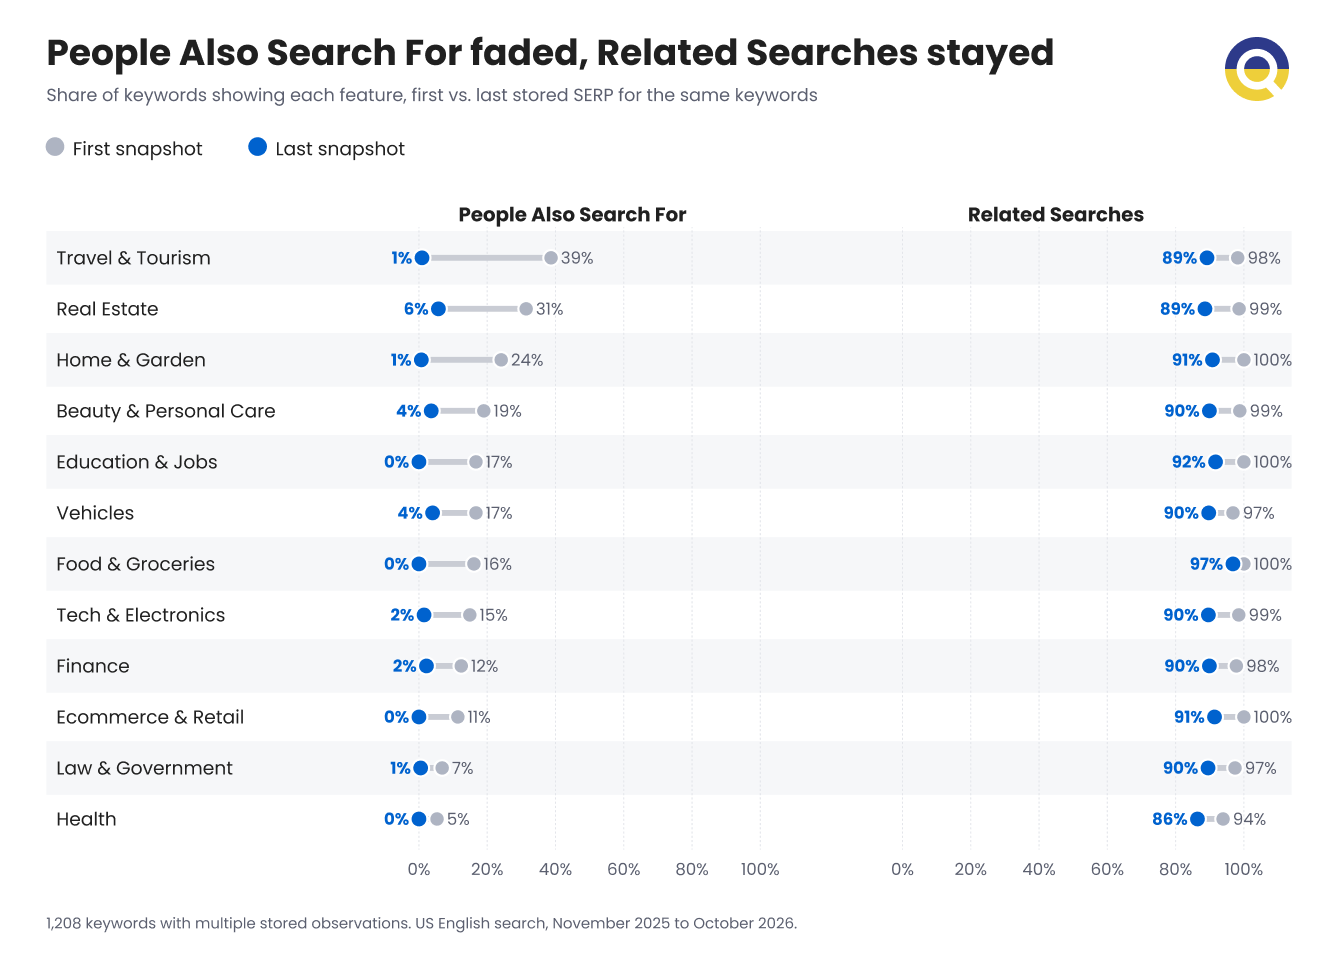
For SEO teams, this makes Related Searches a more reliable feature to monitor when researching adjacent queries and identifying opportunities to expand content coverage.
4. Videos And Forums Are Down But Still Hold Their Niches
The Videos feature declined in ten industries, stayed flat in Health, and edged up slightly in Finance. The largest decreases were in Ecommerce & Retail (-11.4 points) and Vehicles (-8.7). Even so, Tech & Electronics still has Videos on 44% of sampled SERPs in the latest snapshot, and Home & Garden on 42%.
Discussions & Forums declined more widely, falling in eleven industries. Education & Jobs was the only exception. The steepest drop was in Beauty & Personal Care (-19.0 points), followed by Vehicles (-11.1). It still appears on 17% of current Health SERPs and 15% of Beauty & Personal Care SERPs, so first-person discussion remains part of the mix in those industries even as the feature declines overall.
5. Some Traditional Features Are Holding Steady
Unlike some of the more noticeable shifts in SERP features, Knowledge Graph and Local Pack showed no consistent direction. Knowledge Graph declined in eight industries, increased in three, and remained unchanged in one, suggesting that changes related to this feature are more dependent on the industry. Local Packs followed a similar pattern, declining in six industries, increasing in three, and staying the same in the other three.
Popular Products were steadier still. Their presence remained unchanged in nine industries, increased slightly in two, and declined slightly in just one. So the data doesn’t support the idea that AI is steadily replacing every familiar SERP feature. Some established formats continue to play an important role, even without significant growth. Popular Products are a good example: they still appear on 48% of current Home & Garden SERPs, making them a prominent part of search results in that industry.
6. What Happened To Featured Snippets?
Featured Snippets are now virtually absent from Google’s search results. However, most of their decline happened before the period covered by our comparison, so this story is rather a background to the present study.
Our larger industry analysis Search Insider 2026, documented this decline based on approximately 75M SERPs: between September 2024 and August 2026, Featured Snippets collapsed from 8.96% to just 0.44% of SERPs.
Given how common AI Overviews have become, it’s tempting to conclude that Google replaced one feature with the other. Our keyword panel offers an interesting indication of this shift. Among the 19 keywords that had a Featured Snippet in their earliest snapshot, none had an AI Overview at the time. In the latest snapshot, 18 of those 19 keywords (95%) have an AI Overview, while none still show a Featured Snippet. That’s a striking change, although the sample is too small to establish a direct replacement.
To see whether this pattern held in a larger sample, we ran an additional side check across 184,000 keywords in our current US database. We found that 64% of keywords have an AI Overview, while just 0.08% still have a Featured Snippet as of November 6, 2026. What’s more, not a single keyword in the sample had both features.
While this doesn’t prove that AIOs directly replaced Featured Snippets, it does show just how completely the two features have diverged.
What This Means For SEO Teams
The changing SERP landscape gives SEO teams an opportunity to refine their strategies, identify new content opportunities, and better align their work with how people search. The findings offer a useful starting point, but the most effective decisions will come from combining industry-level trends with a closer look at the search results your own audiences see.
Start with the SERPs you actually target. Industry averages provide useful context, but they shouldn’t determine your priorities on their own. Finance SERPs, for example, tend to be more answer-focused, with fewer visual or commercial features. Beauty & Personal Care and Home & Garden have a much stronger visual presence. Look at the queries that matter to your business and identify which features appear most often. That’s where your optimization priorities should start.
Build content for more than one type of search experience. AI Overviews are becoming more common, but People Also Ask is growing or holding steady in most industries too. This makes it worth addressing both the main search intent and the related questions users may have. Structure your content so that key information is easy to find, while providing enough depth to answer follow-up questions. Neither feature comes with a guaranteed optimization formula, so monitor how your target queries evolve.
Don’t abandon a format just because its SERP visibility is declining. Images and Videos appear less frequently than before, but they remain prominent in some industries. Discussions & Forums have also lost visibility, yet community perspectives still appear in Health and Beauty & Personal Care results. If these formats help your audience evaluate products, compare options, or find first-hand experiences, they still deserve a place in your content strategy.
Reconsider strategies built around Featured Snippets. With their visibility now close to zero, treating them as a primary optimization target makes little sense. Clear explanations, useful answers, and well-structured pages still matter, but SEO teams need to account for the other formats Google now uses to present information.
Measure outcomes as well as feature appearances. A feature appearing in search results doesn’t automatically mean your website benefits from it. Track changes in SERP features alongside your own impressions, clicks, organic traffic, and conversions. This will help you distinguish between changes in Google’s search results and changes that actually affect your business.
Conclusion: There’s No Single “New Google SERP”
Here’s what we saw, in short:
- Over the last 12 months, AI Overviews became more common in every industry we examined.
- Images, People Also Search For, and Related Searches declined in each.
- People Also Ask proved more resilient, holding steady across industries and even growing in some.
- Video and Discussions & Forums fell in most industries.
- Featured Snippets are now close to absent in the latest samples.
The differences between industries may matter more than any single trend.
- Finance SERPs are comparatively answer-focused, while Beauty & Personal Care and Home & Garden retain a strong visual and commercial presence.
- Travel & Tourism has particularly high People Also Ask visibility, while Real Estate continues to show a stronger local and review-oriented character, even as AI Overviews gain ground.
For SEO teams, this means there is no universal formula for adapting to Google’s changing results. They may be moving in a common direction in some respects, but the opportunities for visibility remain very much industry- and query-specific. The best starting point is to understand the SERPs behind your target keywords, identify which features matter most in your industry, and monitor how they change over time. Solutions like DataForSEO SERP API and DataForSEO Labs API can help you keep track of these changes at the keyword level.
Methodology and Limitations
This analysis covers US English-language searches from November 2025 through October 2026, using keywords with at least 10 monthly searches. It includes 1,357 keywords with stored Google SERP history across 12 industries, with 6,348 historical snapshots in total.
Each stored snapshot is a fully parsed Google results page, captured for a specific keyword, market, and date, with every feature present on that page recorded (AI Overview, People Also Ask, Images, and ~30 more feature types). The storage retains 365 days of history, which defines the study window.
Unit of analysis. The unit is one keyword. For each keyword we pulled its complete stored snapshot history inside the window — not a single SERP, but every snapshot the storage holds for it (on average 4.7 snapshots per keyword, captured roughly every 2–3 months).
Panel construction. For each of the 12 verticals we drew a deterministic random sample of keywords from that vertical’s population in the US/English Google keyword database. Selection rules were identical for all industries: a light search volume floor (at least 10 searches/month), random sampling with a fixed seed, and no other filtering. 45% of the initially sampled keywords had no stored history and were excluded. The current-state figures are based on 1,357 keywords; changes are measured on the subset seen at least twice (1,208).
Panel sizes:
| Vertical | Keywords | Vertical | Keywords |
| Law & Government | 203 | Finance | 103 |
| Beauty & Personal Care | 186 | Tech & Electronics | 80 |
| Home & Garden | 159 | Real Estate | 82 |
| Health | 149 | Education & Jobs | 55 |
| Vehicles | 147 | Ecommerce & Retail | 42 |
| Travel & Tourism | 114 | Food & Groceries | 37 |
Date consistency across industries. All 12 panels were measured over the identical window: November 1, 2025 through October 2026, in the same market (United States, English), from the same snapshot store, with the same selection rules. Snapshot dates inside the window are keyword-driven (each keyword carries its own capture dates), so two consistency rules make cross-industry comparisons fair:
- For change measurements, each keyword is compared with itself — its earliest stored snapshot in the window versus its latest. The median timespan between a keyword’s first and last snapshot is nearly identical across industries (264–284 days, about nine months), so the change figures are measured over comparable periods everywhere. All growth and decline numbers in this article use this paired, same-keyword comparison.
- For the current fingerprint, each vertical’s picture is the latest stored snapshot of every keyword in its panel. These snapshots are fresh and similarly distributed across industries: about 76% were captured in August–October 2026 (the median latest snapshot falls in September 2026).
What we deliberately did not do. We did not count a feature twice when it appears multiple times on one page.
Error margins. For the large panels (103–203 keywords), shares carry a sampling margin of roughly ±5–8 pp. The five smaller panels (Tech, Real Estate, Education, Retail, Food — 37–82 keywords) carry ±8–16 pp; single-feature differences under ~10 pp in those verticals should be read as directional rather than exact.