
Chupp Industrial is a family equipment business in Chouteau, Oklahoma. Our lines range from mini excavators and mini skid steers to skid-steer attachments, aerial lifts, and fabric buildings. That is a lot of products for a small team, and every one of them could have a dozen pages written about it: a buying guide, a comparison, a spec explainer, an FAQ, a page for every brand that someone might search for.
For years we decided which pages to write the way most small businesses do. Somebody had a hunch, or a customer asked a question twice, and a page got written. Some of those pages did well. Most of them were never seen by anyone, and we had no way of knowing which would be which until months later.
This post walks through the workflow we use now. In short, we combine two kinds of data: what Google already shows us (Google Search Console) and what people actually search for, whether or not we show up (DataForSEO). Then a small set of written rules decides what gets built, and every page is graded after it goes live, so the next decision is better than the last.
Two data sources, two different questions
The most useful thing we learned is that neither source is enough on its own.
Search Console answers “what are we already being shown for?” It is the truth about our own site: real impressions, real clicks, real average positions. But it is blind to everything we do not rank for. A phrase with 30,000 searches a month that we never appear for simply does not exist in Search Console.
DataForSEO answers “what do people actually search for?” The historical keyword data endpoint gives monthly search volume for any phrase, whether or not we rank. On its own, though, a big number tells you nothing about whether a small dealer has any chance of ranking for that phrase.
Put the two side by side, and you get the number we lean on most: impressions divided by monthly search volume. That ratio says how visible we really are for a phrase.
Here is a real example. DataForSEO puts “mini excavator for sale” at 33,100 searches a month in the US. In October, our site was shown for that exact phrase 40 times. That is about 0.1% visibility for one of the most valuable phrases in our whole category. Search Console alone made that look like a minor query. DataForSEO showed it was a big gap.
Step 1: Pull Search Console every night
We copy Search Console into our own database every night: daily totals, daily numbers per page, and daily numbers per query and page. Each run re-pulls the last five days, because Google keeps revising recent data. Having it in our own tables, rather than only on the Search Console screen, is what makes everything below possible. We can join it to anything.
Step 2: Look up search volume for everything we see
For each phrase we are considering, plus the queries Search Console already shows us for (up to 400 at a time), we ask DataForSEO’s historical_keyword_data endpoint for monthly volume, CPC, and competition. A call looks like this:
import base64, json, urllib.request

def volumes(keywords, login, password):
    body = [{"keywords": keywords, "location_code": 2840, "language_code": "en"}]
    req = urllib.request.Request(
        "https://api.dataforseo.com/v3/dataforseo_labs/google/historical_keyword_data/live",
        data=json.dumps(body).encode(),
        headers={
            "Authorization": "Basic " + base64.b64encode(f"{login}:{password}".encode()).decode(),
            "Content-Type": "application/json",
        },
    )
    task = json.load(urllib.request.urlopen(req, timeout=60))["tasks"][0]
    out = {}
    for item in (task.get("result") or [{}])[0].get("items") or []:
        info = (item.get("history") or [{}])[0].get("keyword_info") or {}
        out[item["keyword"]] = (info.get("search_volume"), info.get("cpc"))
    return out
Three small habits keep this cheap and safe:
1. Cache for 30 days. Each volume is added to a table with the date it was fetched, and we reuse the table for a month. Search volume does not change quickly enough to justify paying for it twice.
Our table now holds about 62,000 phrases, collected since August.
2. Put a spending cap in code. Every paid call checks a monthly budget first. When the budget is used up, the call is skipped, not queued.
3. Fail open. Keyword data is extra evidence, never a gate. If the API is down or a phrase has no data, the job carries on and logs that it went without. A content job that breaks because a lookup failed is worse than a content job with slightly less information.
To widen the list, we also call keyword_suggestions on a seed phrase (top 20 by volume). This is where many of our best long-tail topics came from: phrases people type that we would never have guessed.
Step 3: The decision rules
This is the part that took the longest to get right. The data only helps if you write down what you will do with it.
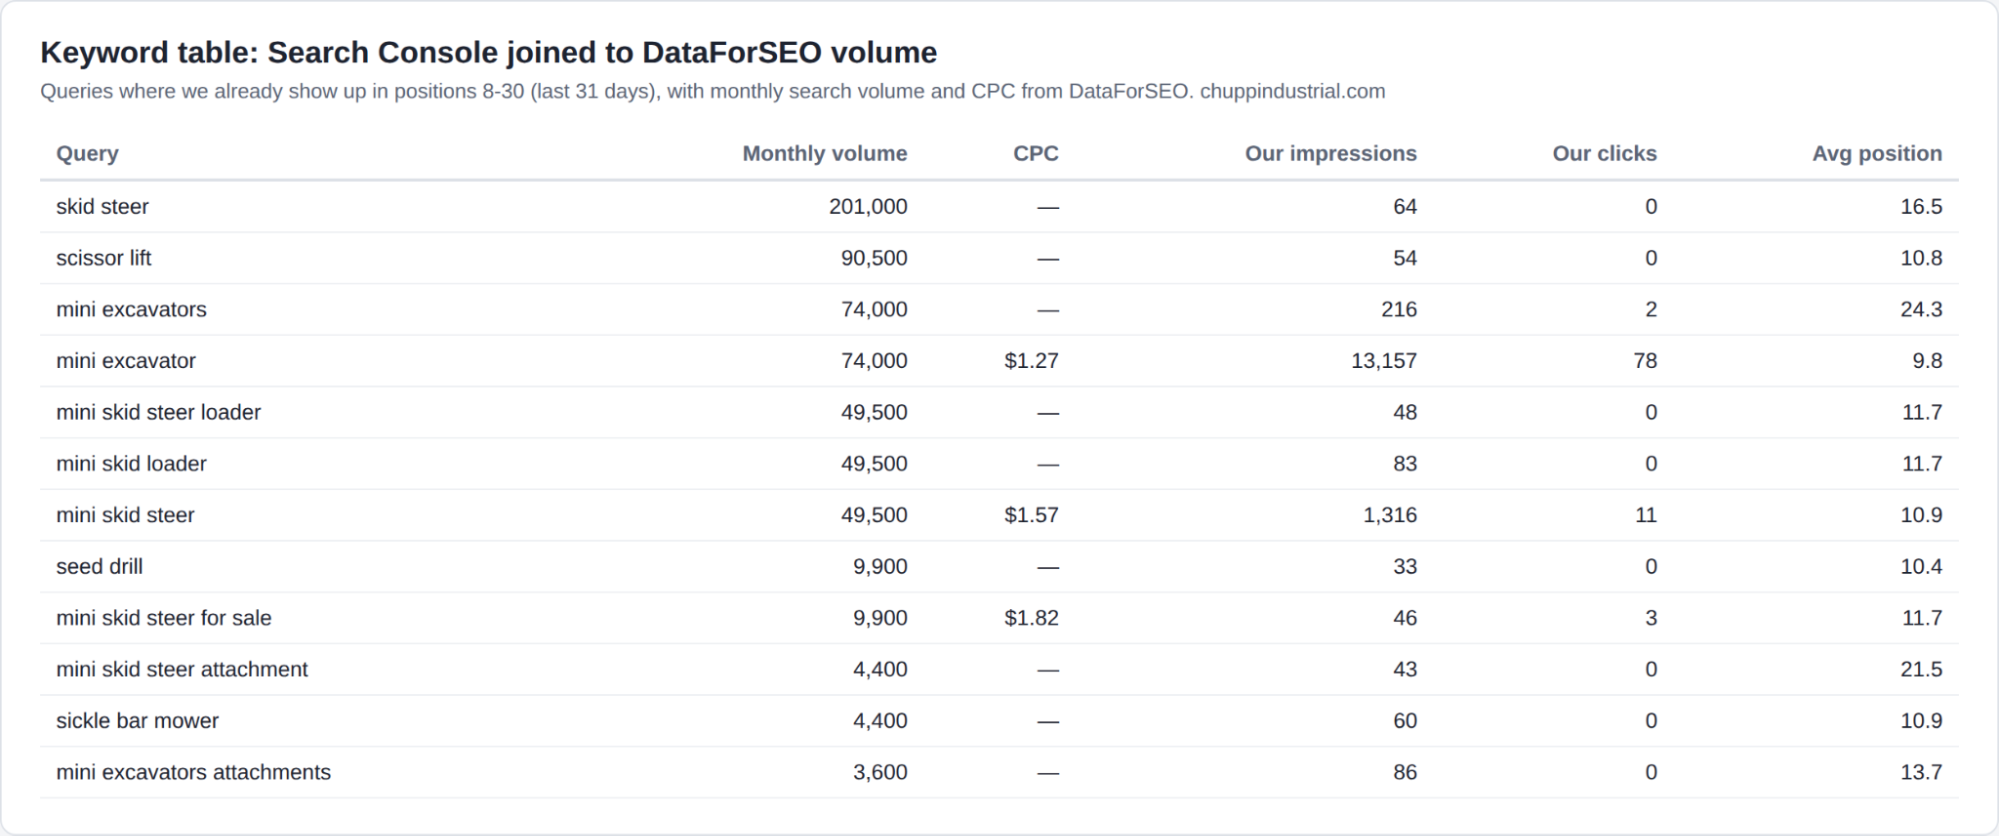
These are the rules we actually run.
Rule 1: Big head terms belong to category pages, not articles. A one- or two-word phrase with more than 20,000 searches a month (“mini excavator” is 74,000, “mini skid steer” is 49,500) is dropped from the list of article topics. Our main category page is the only page that goes after a term like that. A blog post aimed at “mini excavator” competes with our own category page and with manufacturers and marketplaces far bigger than we are. The same phrase with three or four more words (“mini excavator bucket sizes”, “how deep can a mini excavator dig”) is a perfectly good article topic.
Rule 2: Striking distance comes first. A query in which our average position is between 4 and 30, and we have at least 30 impressions in the last 28 days is a “striking distance” query.
Google already thinks we are relevant; we are just not on page one, or not at the top of it. Those queries (up to 12 at a time), plus our top queries, go to whoever is writing the next piece, sorted by DataForSEO volume. Improving a page Google already shows tends to pay back faster than writing something brand new.
Rule 3: Volume is not intent. Some of our biggest numbers are useless to us. “Mini skid steer rental” and its variants each show 12,100 searches a month. We do not rent equipment, so a page for those phrases would attract people we cannot help, and their quick exit back to the results tells Google the page is a poor match. Every phrase gets a human check: would the person typing this want something we actually do?
Rule 4: A topic only gets its own page if it has real volume AND real, different content. This rule came from a mistake. One of our lines is replacement covers for fabric buildings, and buyers search with the brand name of the building they already own. DataForSEO showed “shelterlogic replacement cover” at 2,900 searches a month on Google (150 on Bing), against just 20 (10 on Bing) for “hoop barn replacement cover.” We built six brand pages in one go. On review the same day, most were near-copies of each other with the brand name swapped. Google’s spam policies treat near-identical pages built for search variations as doorway pages, and that can drag down the whole section. We cut six pages to two.
The rule we wrote down afterward is simple: if you can’t write three paragraphs that are only true for that topic, it doesn’t get a page. Smaller variations get a sentence on the main page instead. DataForSEO tells us whether a page is worth having. The three-paragraph test tells us whether we can make it worth reading.
Rule 5: Check what is already there. Before anything new is written, the titles already on the blog are passed in alongside the keyword list, so we don’t publish a second article on a topic we have already covered.
Step 4: Grade every page after it goes live
Without this step, all of the above is still guessing. Every piece of content we publish gets a verdict, written to a table, on a fixed schedule.
Articles are judged on days 8 through 35 after they go live (the first week is ignored while Google settles). Each article gets one of three verdicts:
- Earning: at least one click from search in the window.
- Shown: impressions, but no clicks yet.
- Invisible: no impressions at all.
FAQ updates are judged on the page’s 28 days before the change against days 8 to 35 after it. The site-wide change over the same period is divided out, so a site-wide traffic jump does not get credited to one FAQ. A result 25% better than expected counts as better, 25% worse counts as worse, and anything in between is flat. Below 100 impressions across both windows, the honest verdict is “too little data,” and we record it as such rather than guessing.
Changes to existing pages (a rewritten title, a new spec table) are logged with a before baseline and graded the same way, on click-through rate against what that position would normally earn.
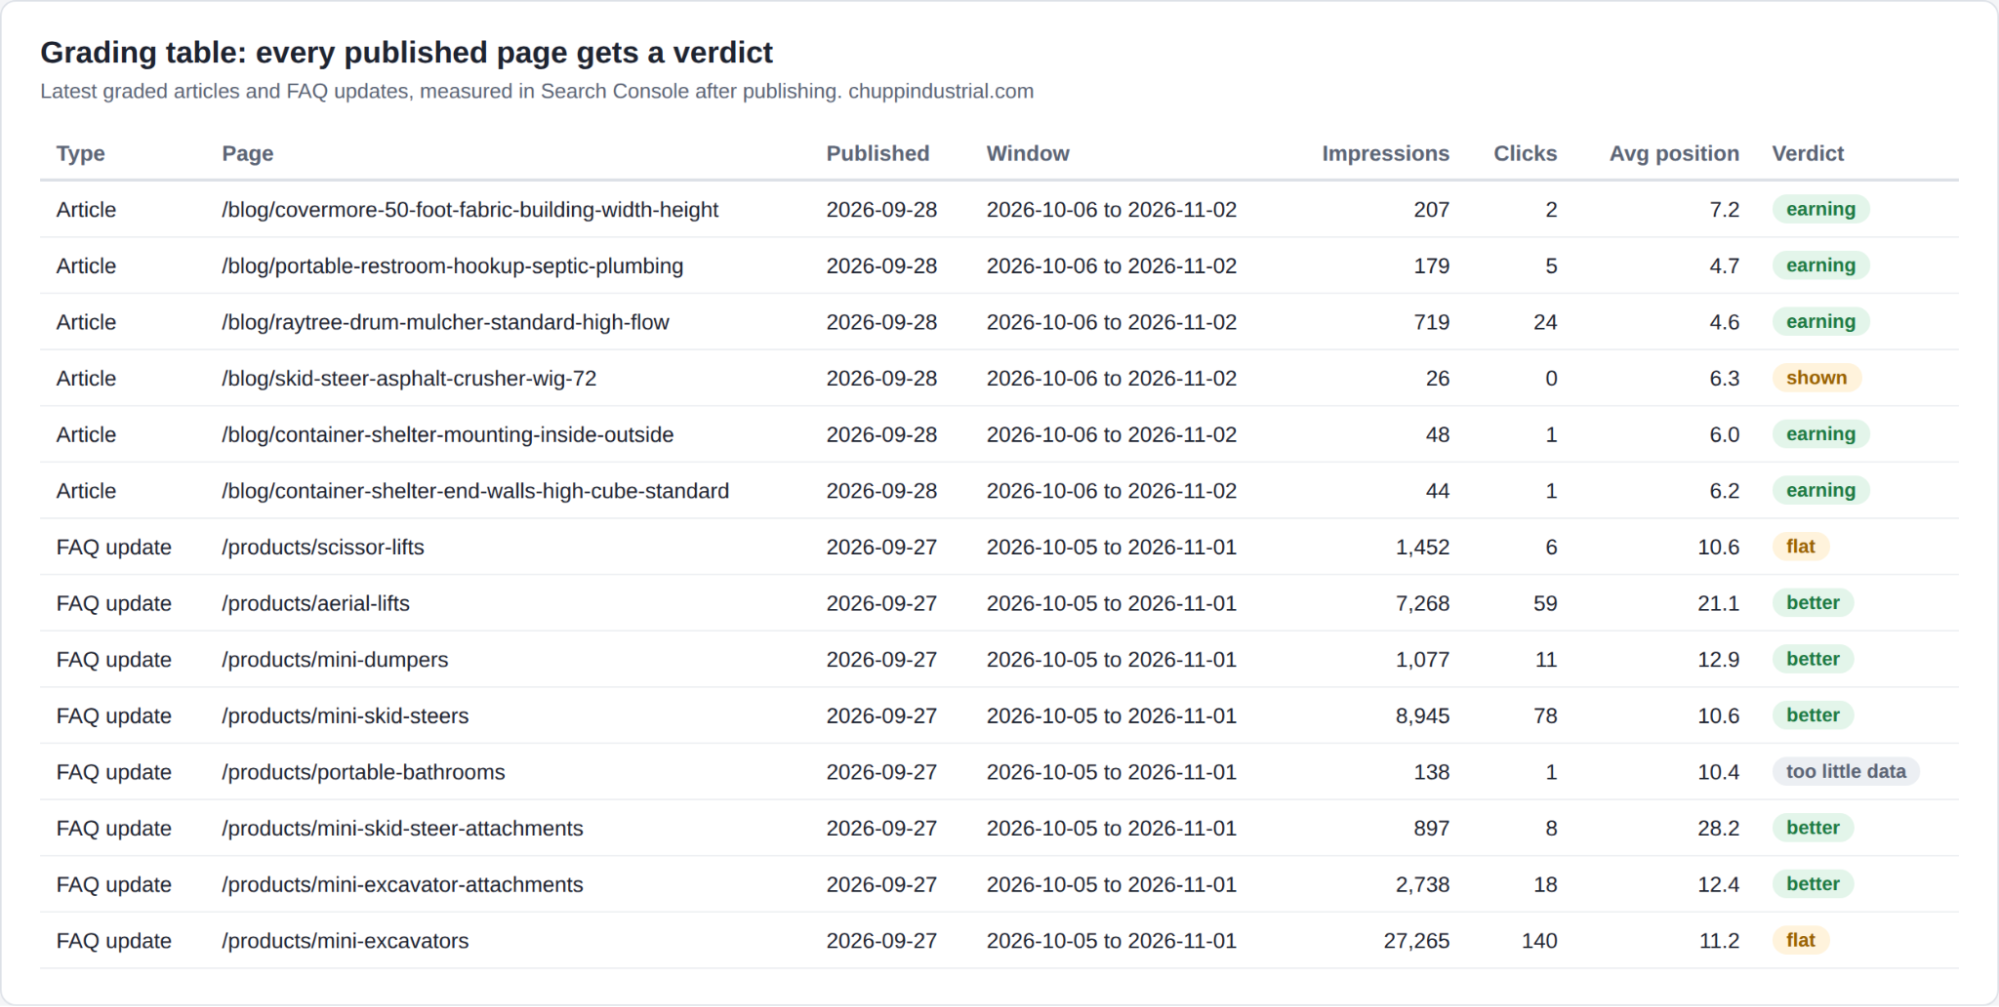
Those verdicts are passed back into the next round. When the next article is planned, it gets a short list of which earlier pieces are earning and which are invisible, along with the keyword data. Over time, the topics drift toward the kinds of phrases that have actually worked for us.
The results
Here is our Search Console history for chuppindustrial.com (web search) this year:
- May: 2,200 clicks, 90,725 impressions, average position 5.6
- June: 1,762 clicks, 82,086 impressions, average position 5.9
- July: 1,893 clicks, 82,216 impressions, average position 6.7
- August: 2,952 clicks, 109,837 impressions, average position 8.9
- September: 4,240 clicks, 160,296 impressions, average position 9.3
- October: 7,625 clicks, 300,730 impressions, average position 10.1
[Image: search-console-monthly-2026.png, our own chart of the same Search Console numbers]
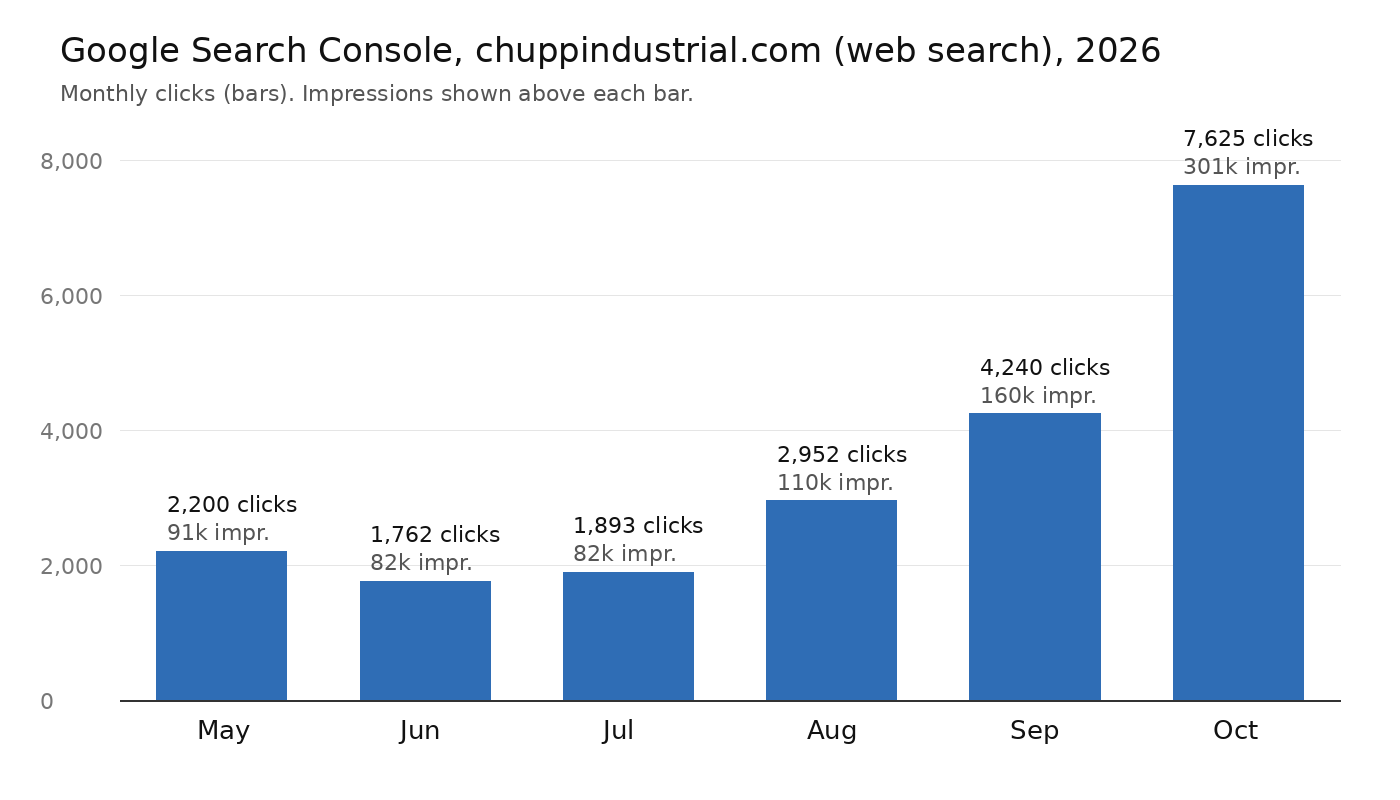
From July to October, monthly clicks from Google search went from 1,893 to 7,625, about four times as many, and impressions went from about 82,000 to about 301,000.
Two honest notes on that table. First, the average position got worse, from 6.7 to 10.1. That is what happens when a site starts appearing for thousands of new long-tail queries: most of them start on page two or three and pull the average down. Average position is close to meaningless on its own once the number of queries is growing quickly. Second, keyword data was not the only thing we changed in those months. We also added product pages and fixed technical problems on the site, so not all of this growth is attributable to the workflow above. What we can say is that this is the period the workflow has been running.
The page we have worked hardest on shows the pattern most clearly. Our mini excavators category page went from 117 impressions and 3 clicks in July to 32,401 impressions and 163 clicks in October. It is still nowhere near where it should be for “mini excavator for sale,” and that 0.1% visibility number is the reason it is at the top of our list.
The grading table is where we learned the most:
- Articles: 69 have been graded so far. 29 are earning (42%), 24 are shown but not yet clicked, and 16 are invisible. The earning ones average about 5 clicks each in their first month, which is small per article but adds up across dozens.
- FAQ updates: 27 batches graded. 13 did better than expected, 6 were flat, and 8 had too little data to call. None were graded worse. The FAQ updates that worked averaged about 31 clicks in the measurement window, far more than a typical new article. Adding answers to pages Google already ranks has been a better use of time than starting new pages from scratch.
About the author: Braden Chupp is a consultant for Chupp Industrial, a family equipment business in Chouteau, Oklahoma, where he built the company’s search and data workflow. See the page this workflow is working hardest on: mini excavators at Chupp Industrial.